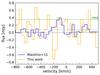
Fig. A.1
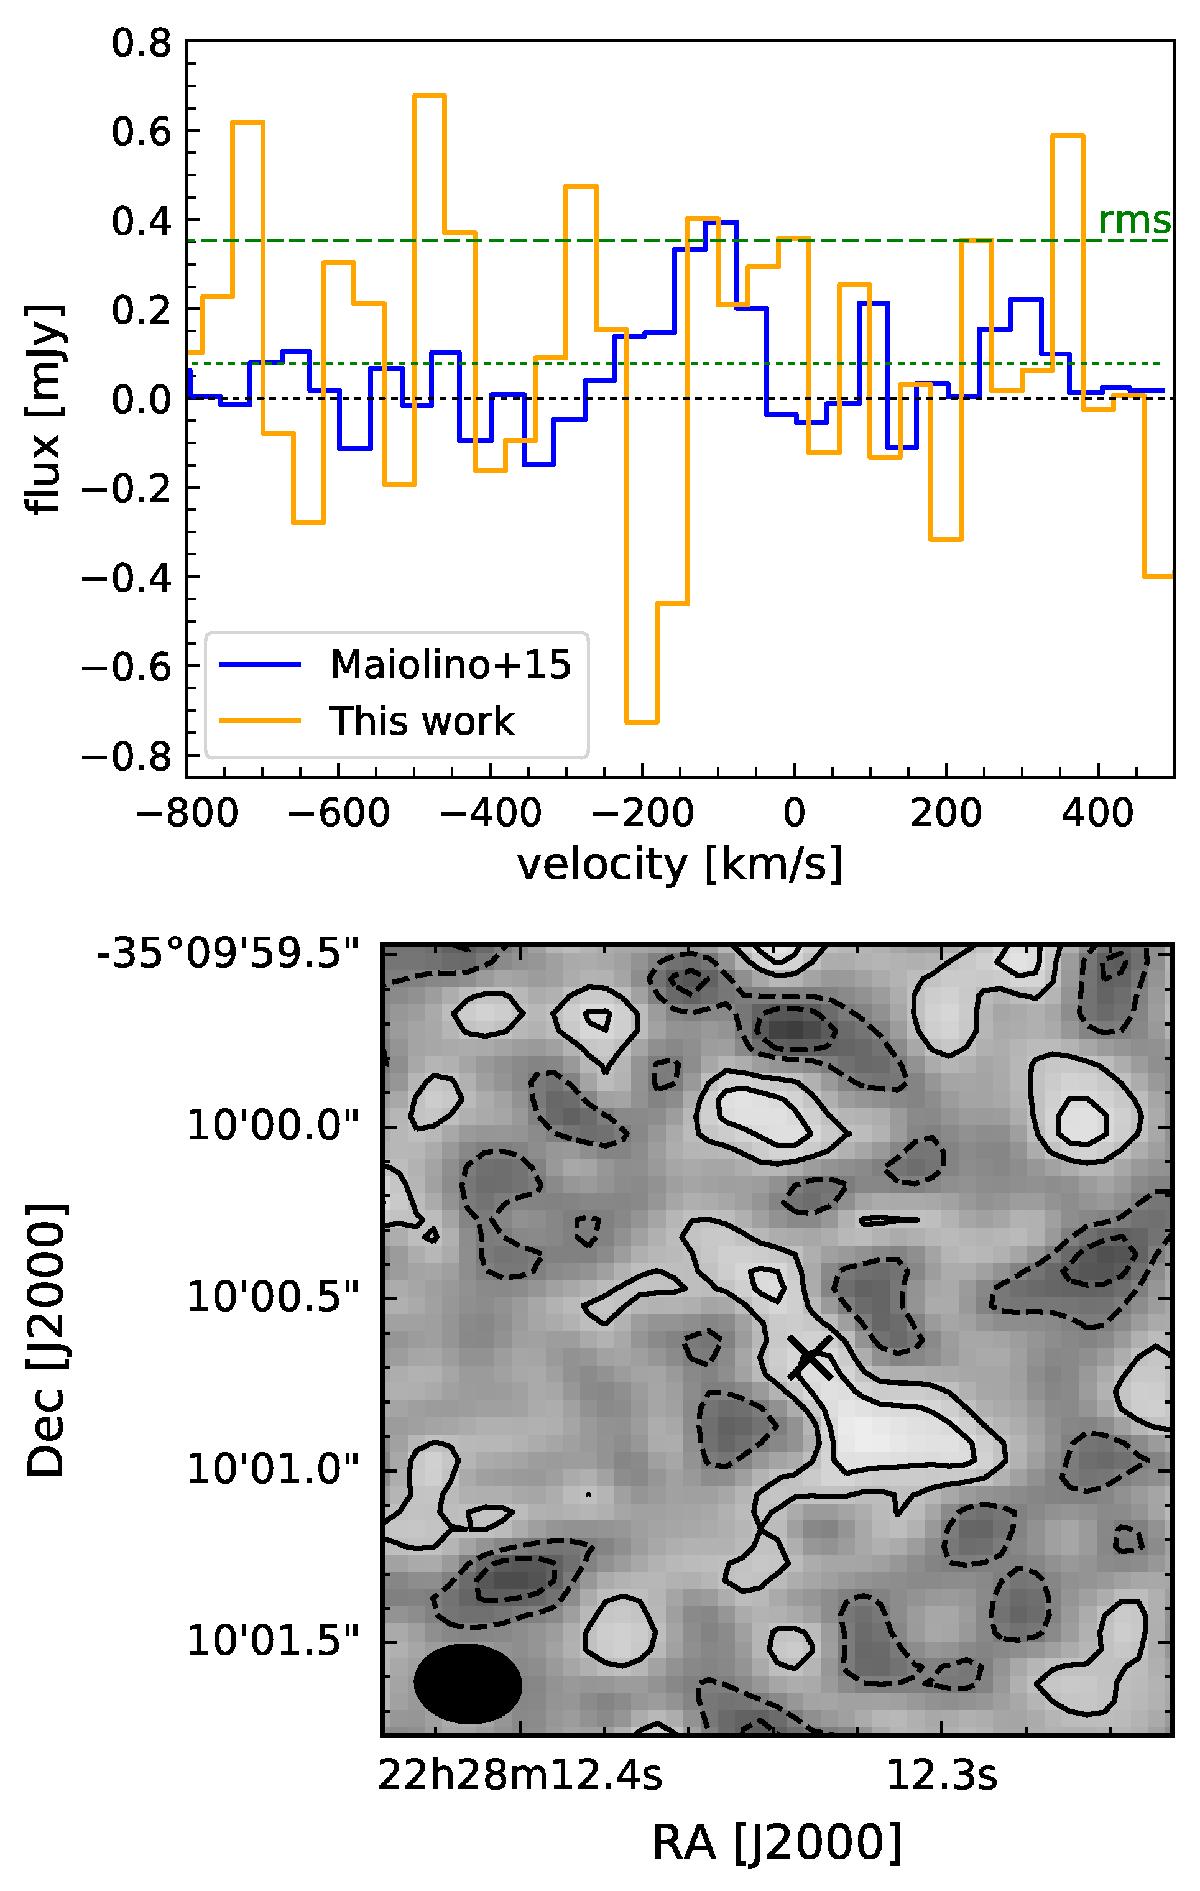
Top: ALMA spectrum of the [C ii] detections, extracted from the an elliptical aperture of size 0.55′′ × 1.03′′ with resolution of 40 km s-1. The blue solid line is the spectrum by Maiolino et al. (2015), while the orange and green lines show the spectrum and noise level obtained from the new high-resolution observations, respectively. Bottom: high-resolution ALMA map (angular-resolution = 0.3′′ × 0.2′′) obtained by integrating the line under the gold shaded region in the top panel of Fig. 2a (i.e. −70 < v < 10 km s-1). Black contours are at levels of –2, –1, 1, and 2 times the noise per beam in the same map, i.e. 9 mJy/beam km s-1.
Current usage metrics show cumulative count of Article Views (full-text article views including HTML views, PDF and ePub downloads, according to the available data) and Abstracts Views on Vision4Press platform.
Data correspond to usage on the plateform after 2015. The current usage metrics is available 48-96 hours after online publication and is updated daily on week days.
Initial download of the metrics may take a while.