Fig. 11
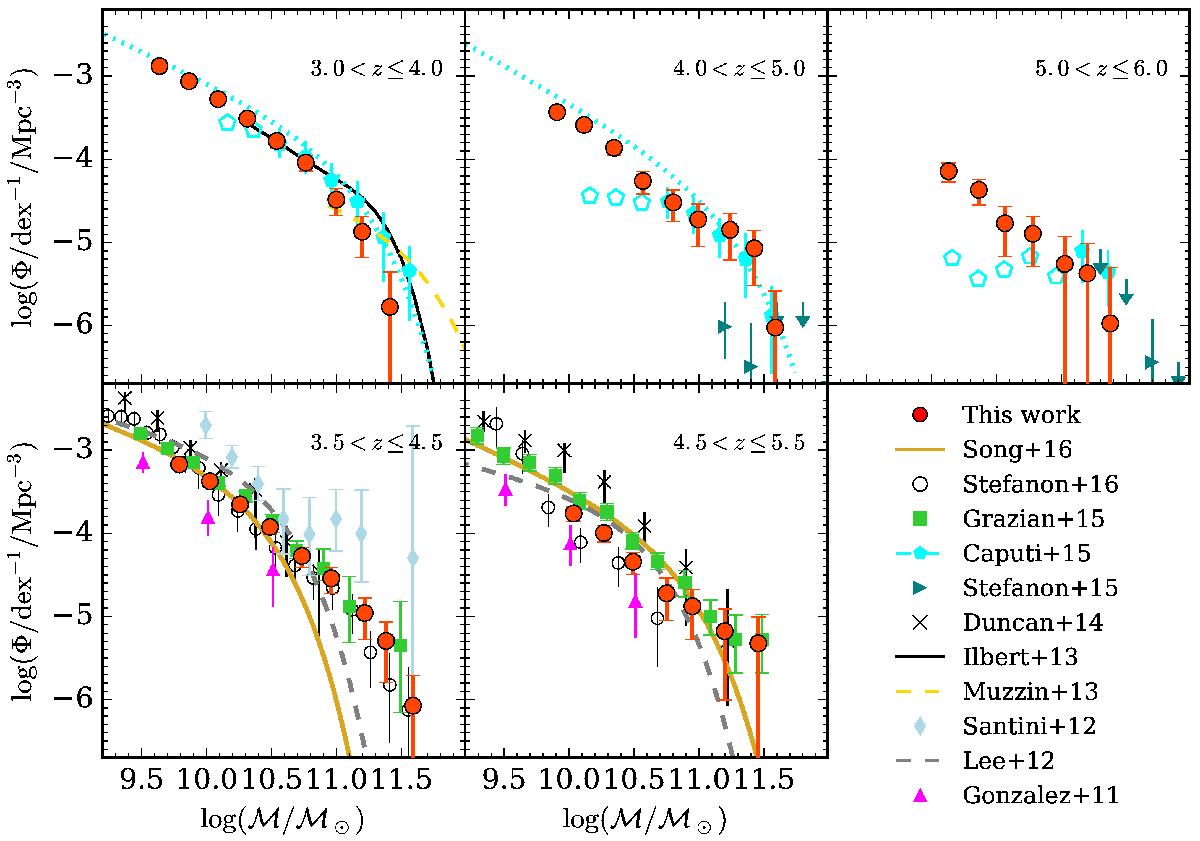
Comparison to galaxy SMFs from the literature. Our 1 /Vmax measurements are shown as red circles. If needed, we converted estimates from the literature to Chabrier (2003) IMF. Upper panels: we plot the SMF estimates from Caputi et al. (2015), with filled (empty) blue pentagons above (below) their mass completeness limit (in addition, their STY fit is shown by a blue dotted line). For sake of clarity, we plot only the Schechter functions (not the 1 /Vmax points that have been fit) from Ilbert et al. (2013) and Muzzin et al. (2013a); in both cases the Schechter function (black solid and yellow dashed line, respectively) is truncated at their stellar mass completeness limit. Rightward triangles and downward arrows show 1 /Vmax and upper limits from a conservative estimate by Stefanon et al. (2015). Lower panels: ℳ-selected SMFs published in Santini et al. (2012, light blue diamonds), Duncan et al. (2014, black crosses), and Grazian et al. (2015, green squares). Other SMFs of LBG samples are taken from González et al. (2011, upward triangles), Lee et al. (2012, grey dashed lines), Song et al. (2016, orange solid line), Stefanon et al. (2017, empty circles).
Current usage metrics show cumulative count of Article Views (full-text article views including HTML views, PDF and ePub downloads, according to the available data) and Abstracts Views on Vision4Press platform.
Data correspond to usage on the plateform after 2015. The current usage metrics is available 48-96 hours after online publication and is updated daily on week days.
Initial download of the metrics may take a while.