Fig. 13
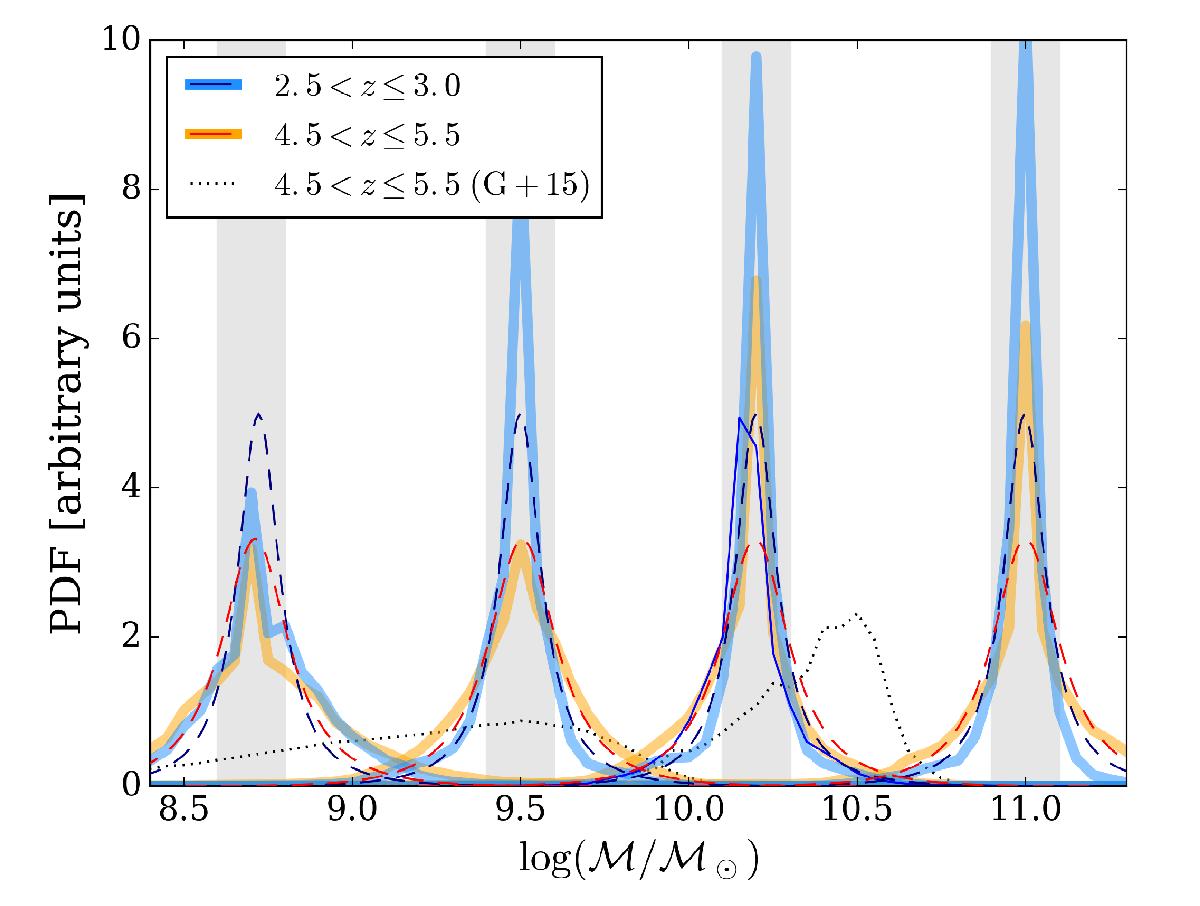
Average PDF(ℳ | z) for galaxies in four bins of stellar mass (highlighted with grey vertical bands), at redshift ![]() (blue solid lines) and
(blue solid lines) and ![]() (orange). The plot also shows the σm(z) uncertainty (see Eq. (1), with dark blue and red dashed lines, in the low and high z-bin respectively. Two examples of z ≃ 5 PDFs from Grazian et al. (2015) are shown with dotted lines; they are obtained by stacking the PDF(ℳ | z) of CANDELS galaxies at 9.4 < log (ℳ/ℳ⊙) < 9.6 and 10.4 < log (ℳ/ℳ⊙) < 10.6 respectively (Chabrier’s IMF). All the PDFs in the figure have been normalised to unity.
(orange). The plot also shows the σm(z) uncertainty (see Eq. (1), with dark blue and red dashed lines, in the low and high z-bin respectively. Two examples of z ≃ 5 PDFs from Grazian et al. (2015) are shown with dotted lines; they are obtained by stacking the PDF(ℳ | z) of CANDELS galaxies at 9.4 < log (ℳ/ℳ⊙) < 9.6 and 10.4 < log (ℳ/ℳ⊙) < 10.6 respectively (Chabrier’s IMF). All the PDFs in the figure have been normalised to unity.
Current usage metrics show cumulative count of Article Views (full-text article views including HTML views, PDF and ePub downloads, according to the available data) and Abstracts Views on Vision4Press platform.
Data correspond to usage on the plateform after 2015. The current usage metrics is available 48-96 hours after online publication and is updated daily on week days.
Initial download of the metrics may take a while.