Fig. 17
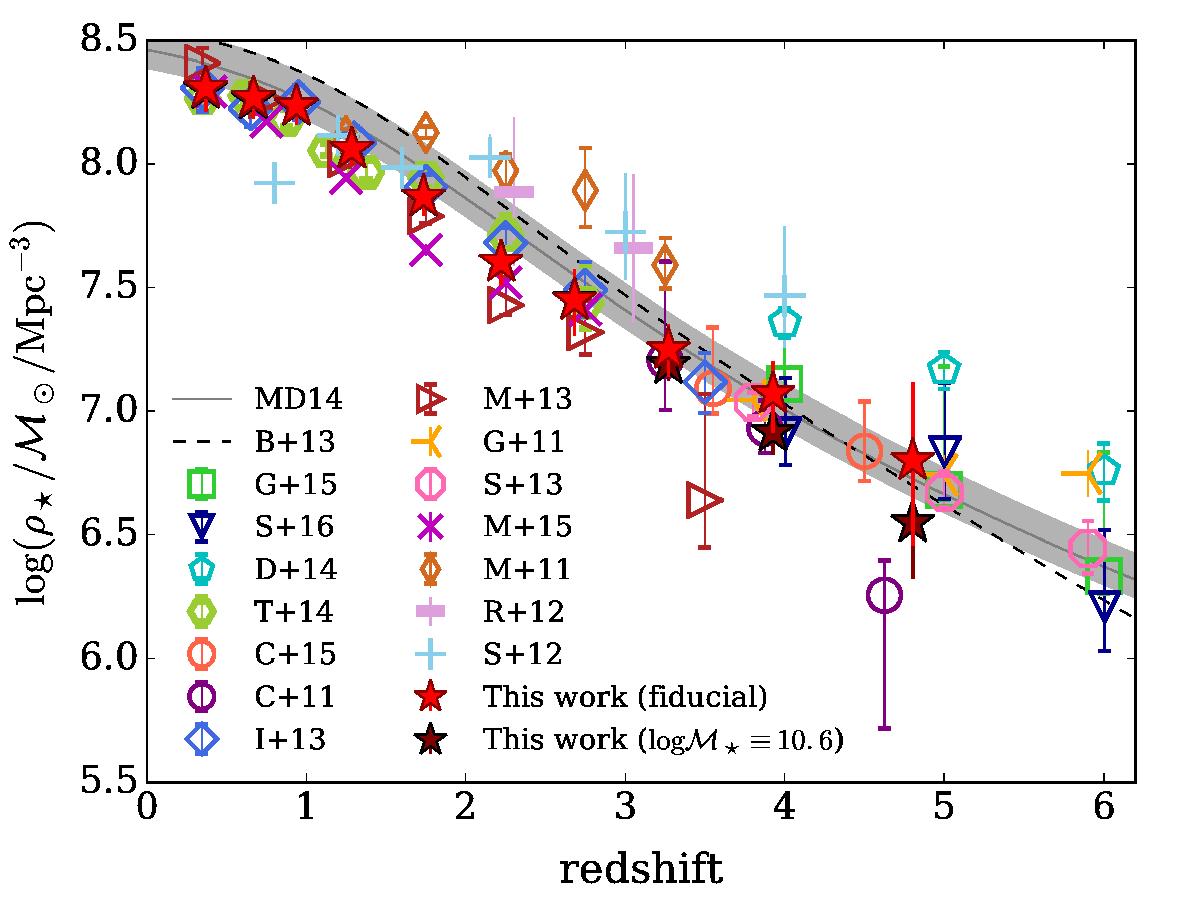
Redshift evolution of ρ∗, as measured in different papers by integration of the SMF: Caputi et al. (2011, C+11 in the legend), Caputi et al. (2015, C+15), Duncan et al. (2014, D+14), González et al. (2011, G+11), Grazian et al. (2015, G15), Ilbert et al. (2013, I+13), Mortlock et al. (2011, M+11), Mortlock et al. (2014, M+15), Muzzin et al. (2013a, M+13), Reddy et al. (2012, R+12), Santini et al. (2012, S+12), Song et al. (2016, S+16), and Tomczak et al. (2014, T+14). If ρ∗ uncertainties are not quoted in the paper, we plot approximate error bars by considering the 1σ error of the α parameter. Red stars are the stellar mass density from our fiducial Schechter, brown stars are from the fit with fixed ℳ⋆. By integrating their SFRD functions, we can plot ρ∗(z) from Behroozi et al. (2013, black dashed line) and Madau & Dickinson (2014, grey solid line). In both integrations we assume freturn = 41% (coherently with Chabrier’s IMF). For Madau & Dickinson (2014) we also show with a shaded area the ρ∗ range enclosed by freturn = 50% and 25% (the latter value is similar to the one prescribed by Salpeter’s IMF).
Current usage metrics show cumulative count of Article Views (full-text article views including HTML views, PDF and ePub downloads, according to the available data) and Abstracts Views on Vision4Press platform.
Data correspond to usage on the plateform after 2015. The current usage metrics is available 48-96 hours after online publication and is updated daily on week days.
Initial download of the metrics may take a while.