Fig. 18
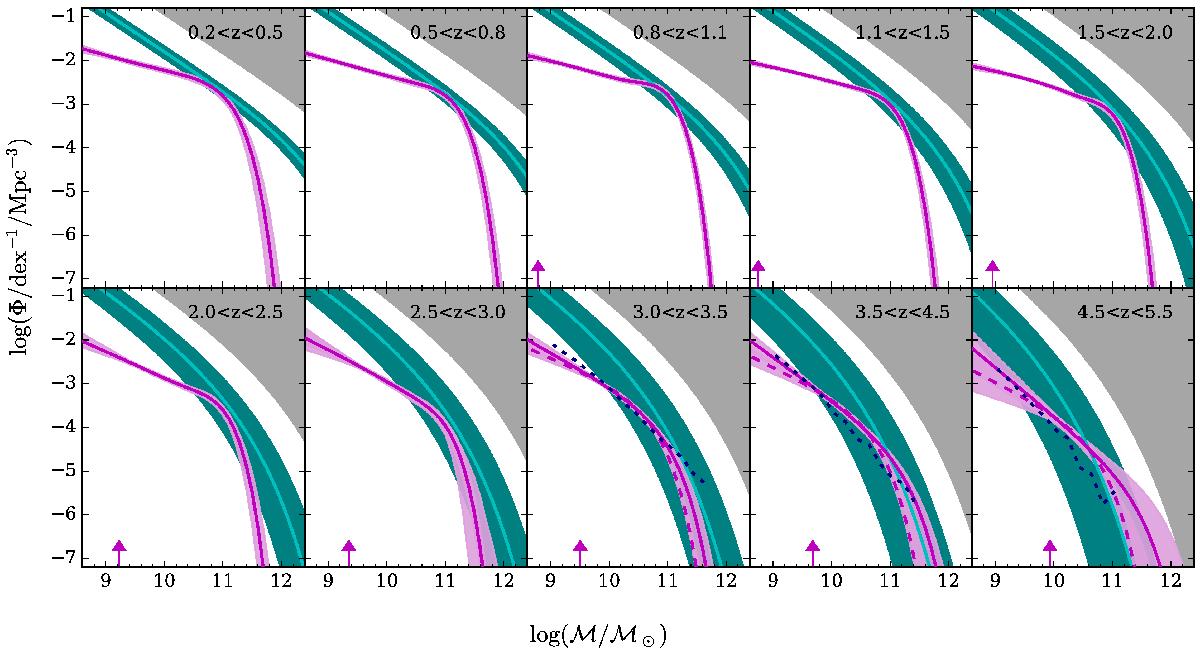
Evolution of HMF (cyan line) vs. SMF (magenta) from z = 0.2 to 5.5. In each panel halo mass is multiplied by a factor 0.018, that is, the SHMR at z = 0 and ![]() (according to Behroozi et al. 2013). Shaded cyan regions show the uncertainties in the HMF shift by taking the 1σ error of the SHMR parametrisation. At z> 2.5, the solid magenta line is our fiducial fit of the SMF, while the dashed magenta line is the Schechter function with log (ℳ⋆/ ℳ⊙) fixed to 10.6 (see Fig. 8). The shaded magenta regions combine the 1σ CL of the two fits, to give a conservative estimate of the uncertainties. A grey shaded area highlights the “forbidden region” where, according to the Ωb/ Ωm ratio, no galaxies are expected. Black dotted lines at z> 3 are the SMFs predicted from the semi-analytical model of Garel et al. (2016), converted to the IMF of Chabrier (2003).
(according to Behroozi et al. 2013). Shaded cyan regions show the uncertainties in the HMF shift by taking the 1σ error of the SHMR parametrisation. At z> 2.5, the solid magenta line is our fiducial fit of the SMF, while the dashed magenta line is the Schechter function with log (ℳ⋆/ ℳ⊙) fixed to 10.6 (see Fig. 8). The shaded magenta regions combine the 1σ CL of the two fits, to give a conservative estimate of the uncertainties. A grey shaded area highlights the “forbidden region” where, according to the Ωb/ Ωm ratio, no galaxies are expected. Black dotted lines at z> 3 are the SMFs predicted from the semi-analytical model of Garel et al. (2016), converted to the IMF of Chabrier (2003).
Current usage metrics show cumulative count of Article Views (full-text article views including HTML views, PDF and ePub downloads, according to the available data) and Abstracts Views on Vision4Press platform.
Data correspond to usage on the plateform after 2015. The current usage metrics is available 48-96 hours after online publication and is updated daily on week days.
Initial download of the metrics may take a while.