Fig. 2
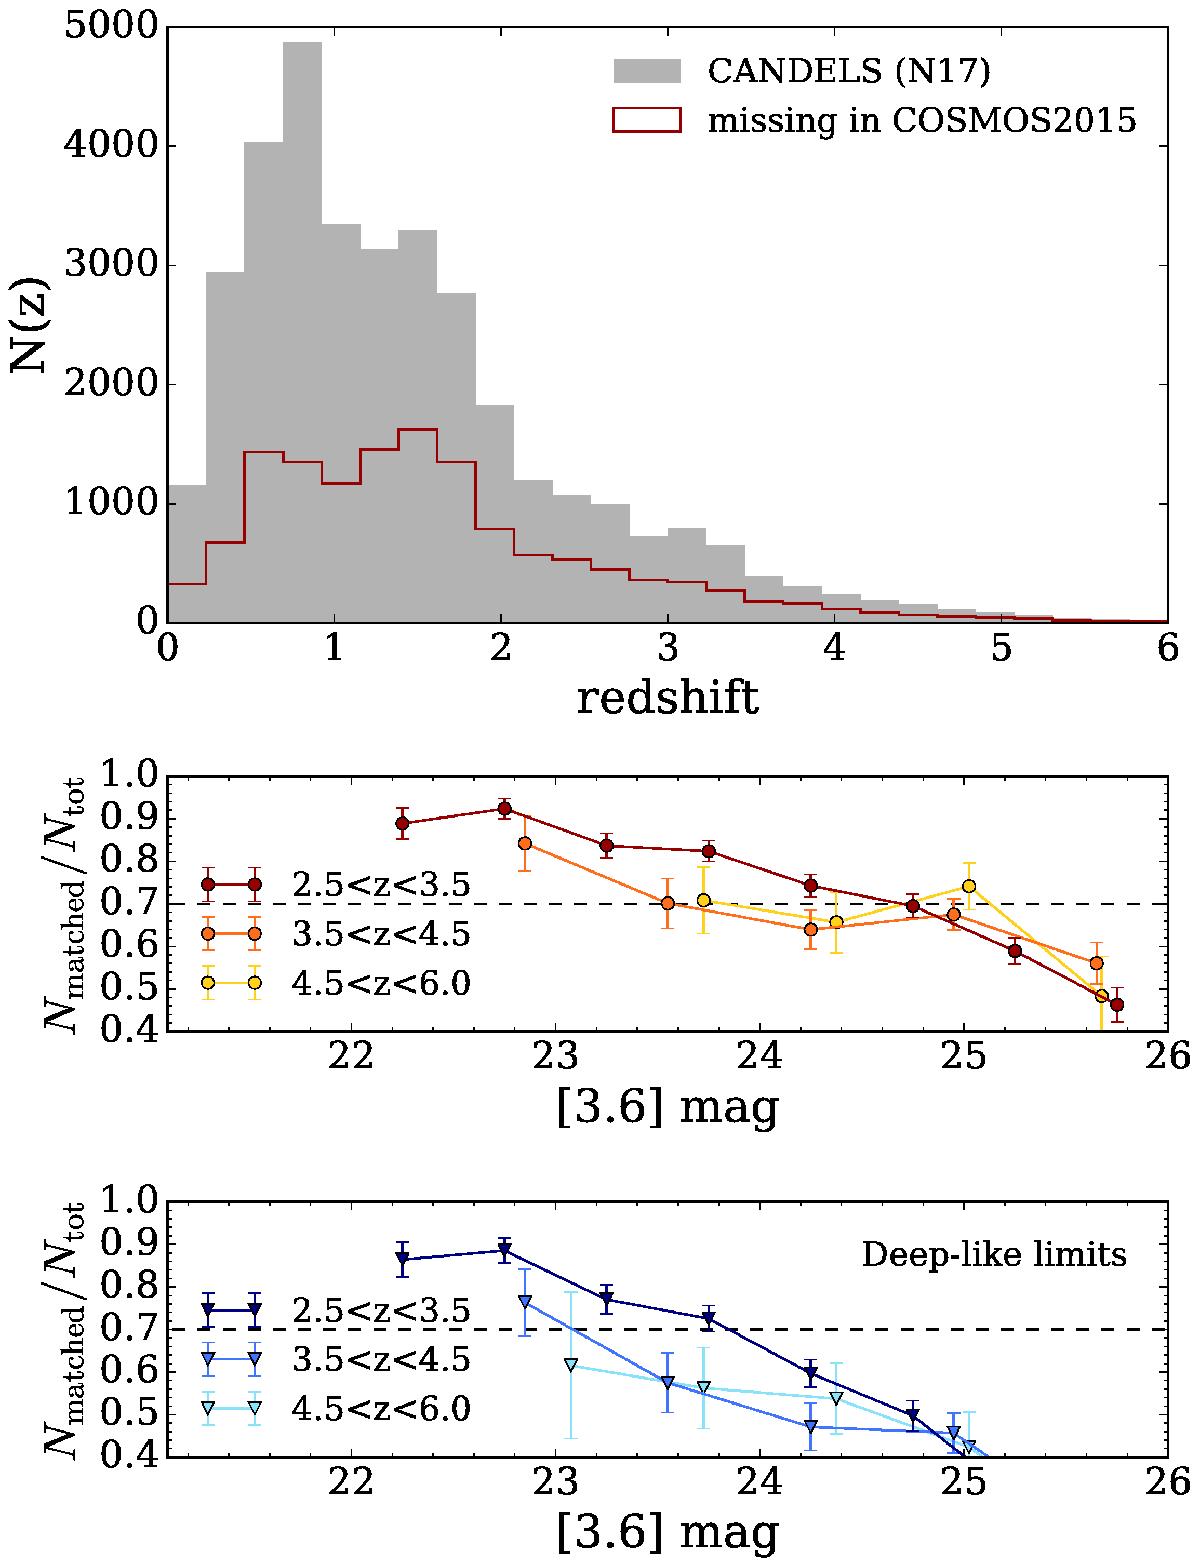
Upper panel: redshift distribution of the whole CANDELS sample in the COSMOS field, taken from Nayyeri et al. (2017, N17, gray filled histogram). We also identify the N17 objects that do not have a counterpart (within 0.8″) in the COSMOS2015 catalogue, showing their N(z) with a red histogram. Middle panel: ratio between the CANDELS objects with a match in COSMOS2015 (Nmatched) and all the CANDELS entries (Ntot) in bins of [3.6] mag (filled circles). These estimates are divided into three redshift bins in the range 2.5 <zphot,N17< 6 (see colour-code inset); a dashed line marks the 70% completeness. Lower panel: similar to the middle panel, but the Nmatched/Ntot ratio is estimated to reproduce the sensitivity depth of UltraVISTA-Deep.
Current usage metrics show cumulative count of Article Views (full-text article views including HTML views, PDF and ePub downloads, according to the available data) and Abstracts Views on Vision4Press platform.
Data correspond to usage on the plateform after 2015. The current usage metrics is available 48-96 hours after online publication and is updated daily on week days.
Initial download of the metrics may take a while.