Fig. B.1
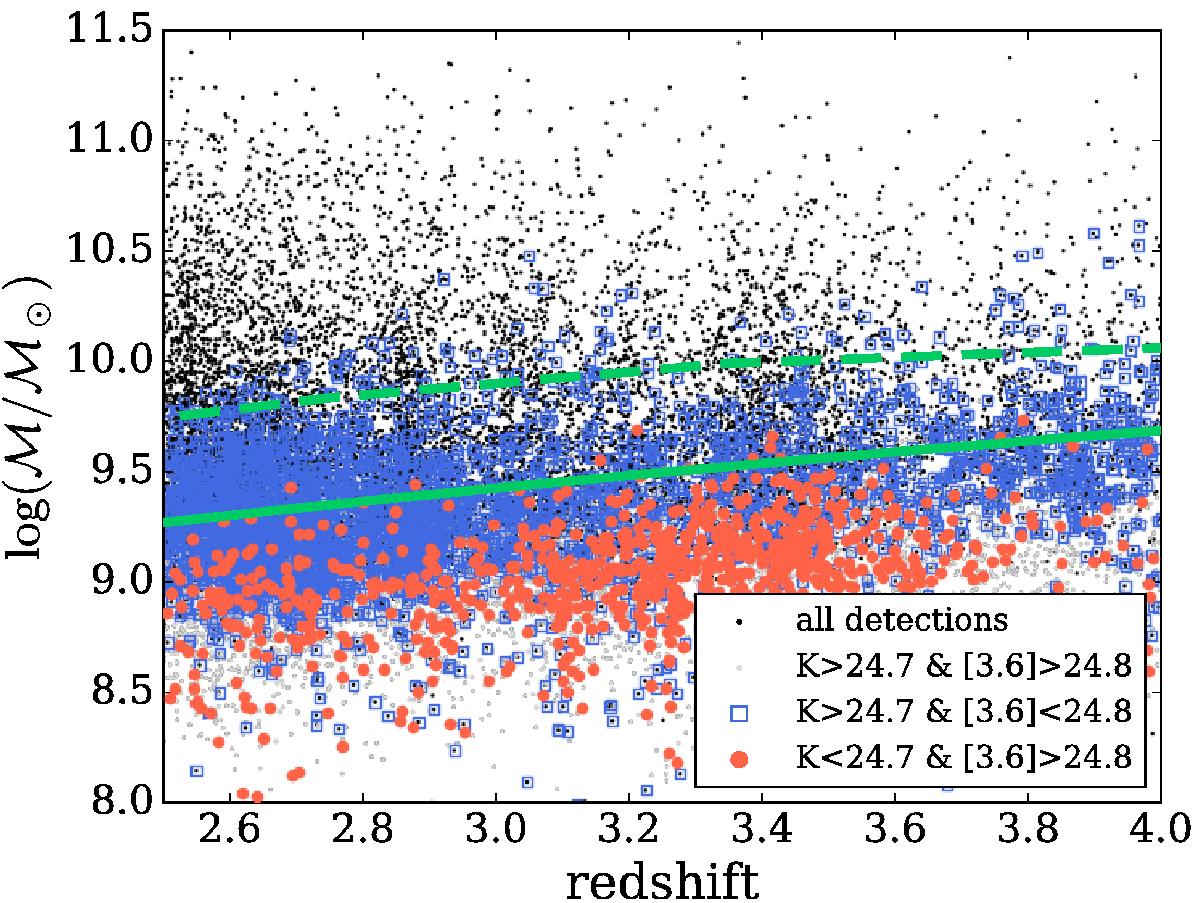
Galaxy stellar mass as a function of redshift, in a range where a cut in either Ks or [3.6] is applicable in order to build a flux limited sample. In the plot, small circles are all the COSMOS2015 galaxies in ![]() , those detected in both Ks and [3.6] (black dots) and the ones that are not (grey dots). Red filled circle (blue empty squares) show galaxies fainter than the [3.6] (Ks) magnitude limit, but detected in Ks ([3.6]). Green lines represent the stellar mass completeness limits ℳlim(z) (see Sect. 4.2) resulting from either the [3.6]-selected sample (solid lines) or the Ks-selected (dashed line).
, those detected in both Ks and [3.6] (black dots) and the ones that are not (grey dots). Red filled circle (blue empty squares) show galaxies fainter than the [3.6] (Ks) magnitude limit, but detected in Ks ([3.6]). Green lines represent the stellar mass completeness limits ℳlim(z) (see Sect. 4.2) resulting from either the [3.6]-selected sample (solid lines) or the Ks-selected (dashed line).
Current usage metrics show cumulative count of Article Views (full-text article views including HTML views, PDF and ePub downloads, according to the available data) and Abstracts Views on Vision4Press platform.
Data correspond to usage on the plateform after 2015. The current usage metrics is available 48-96 hours after online publication and is updated daily on week days.
Initial download of the metrics may take a while.