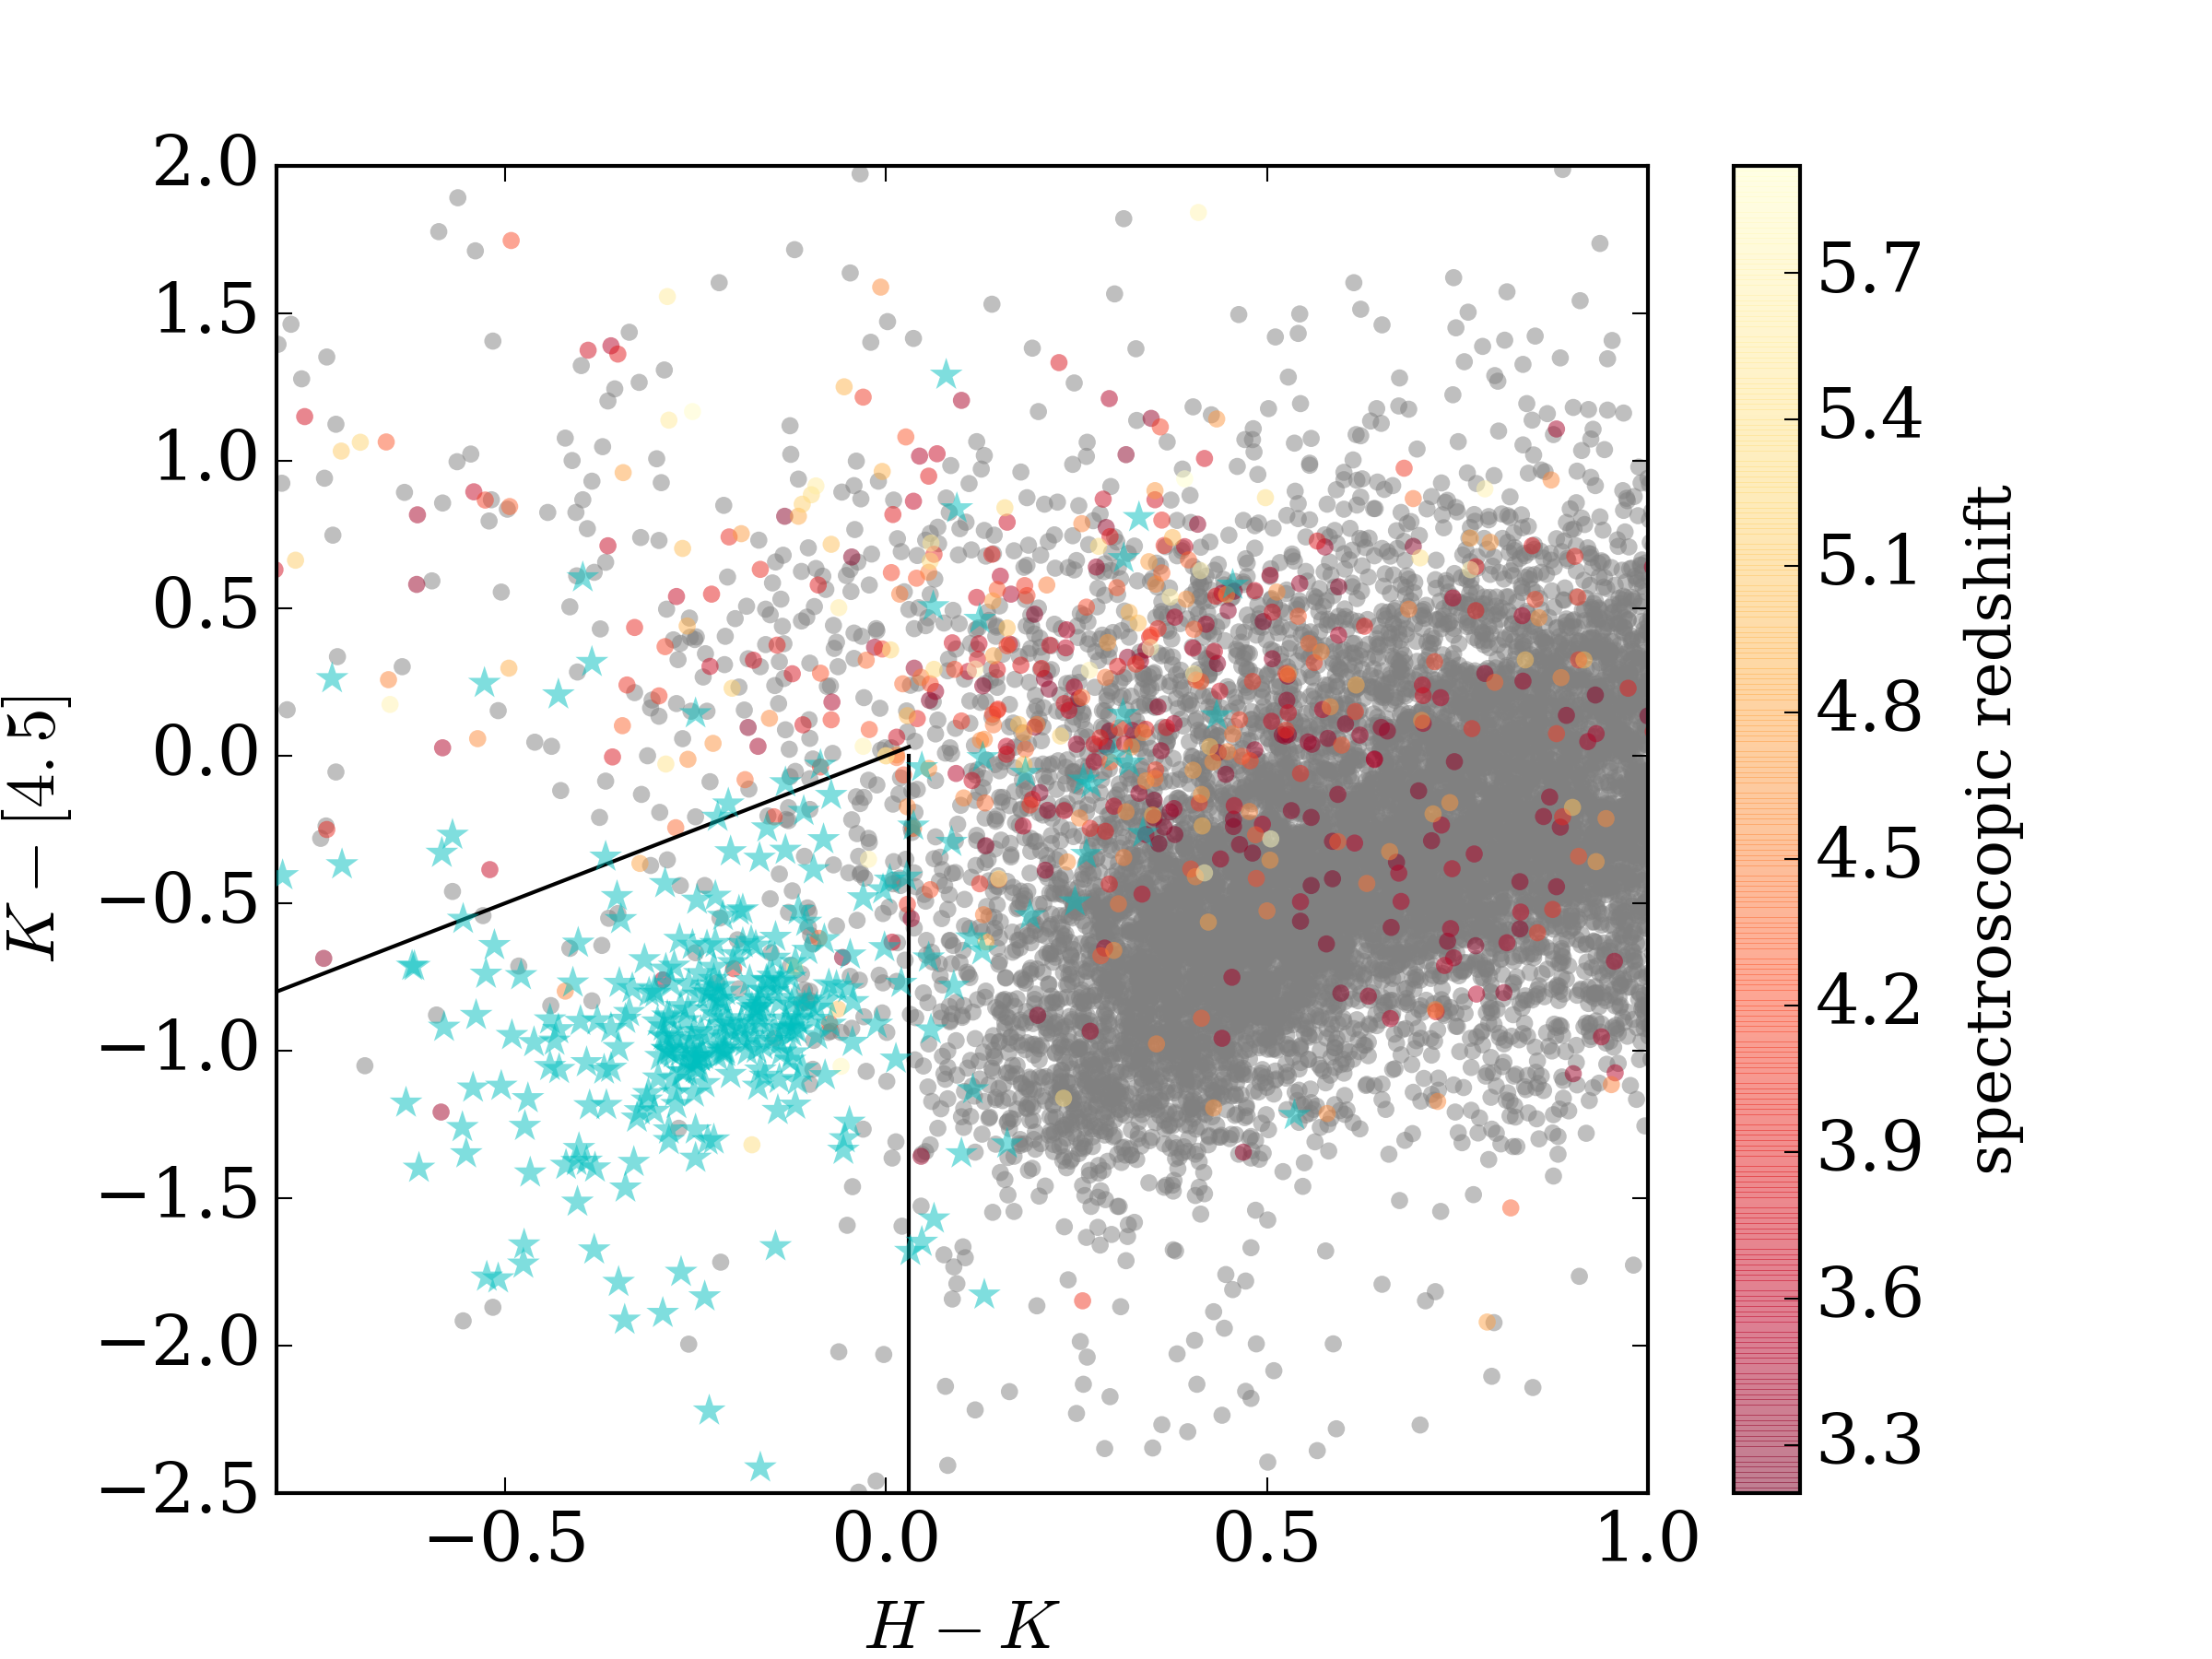
Fig. 3
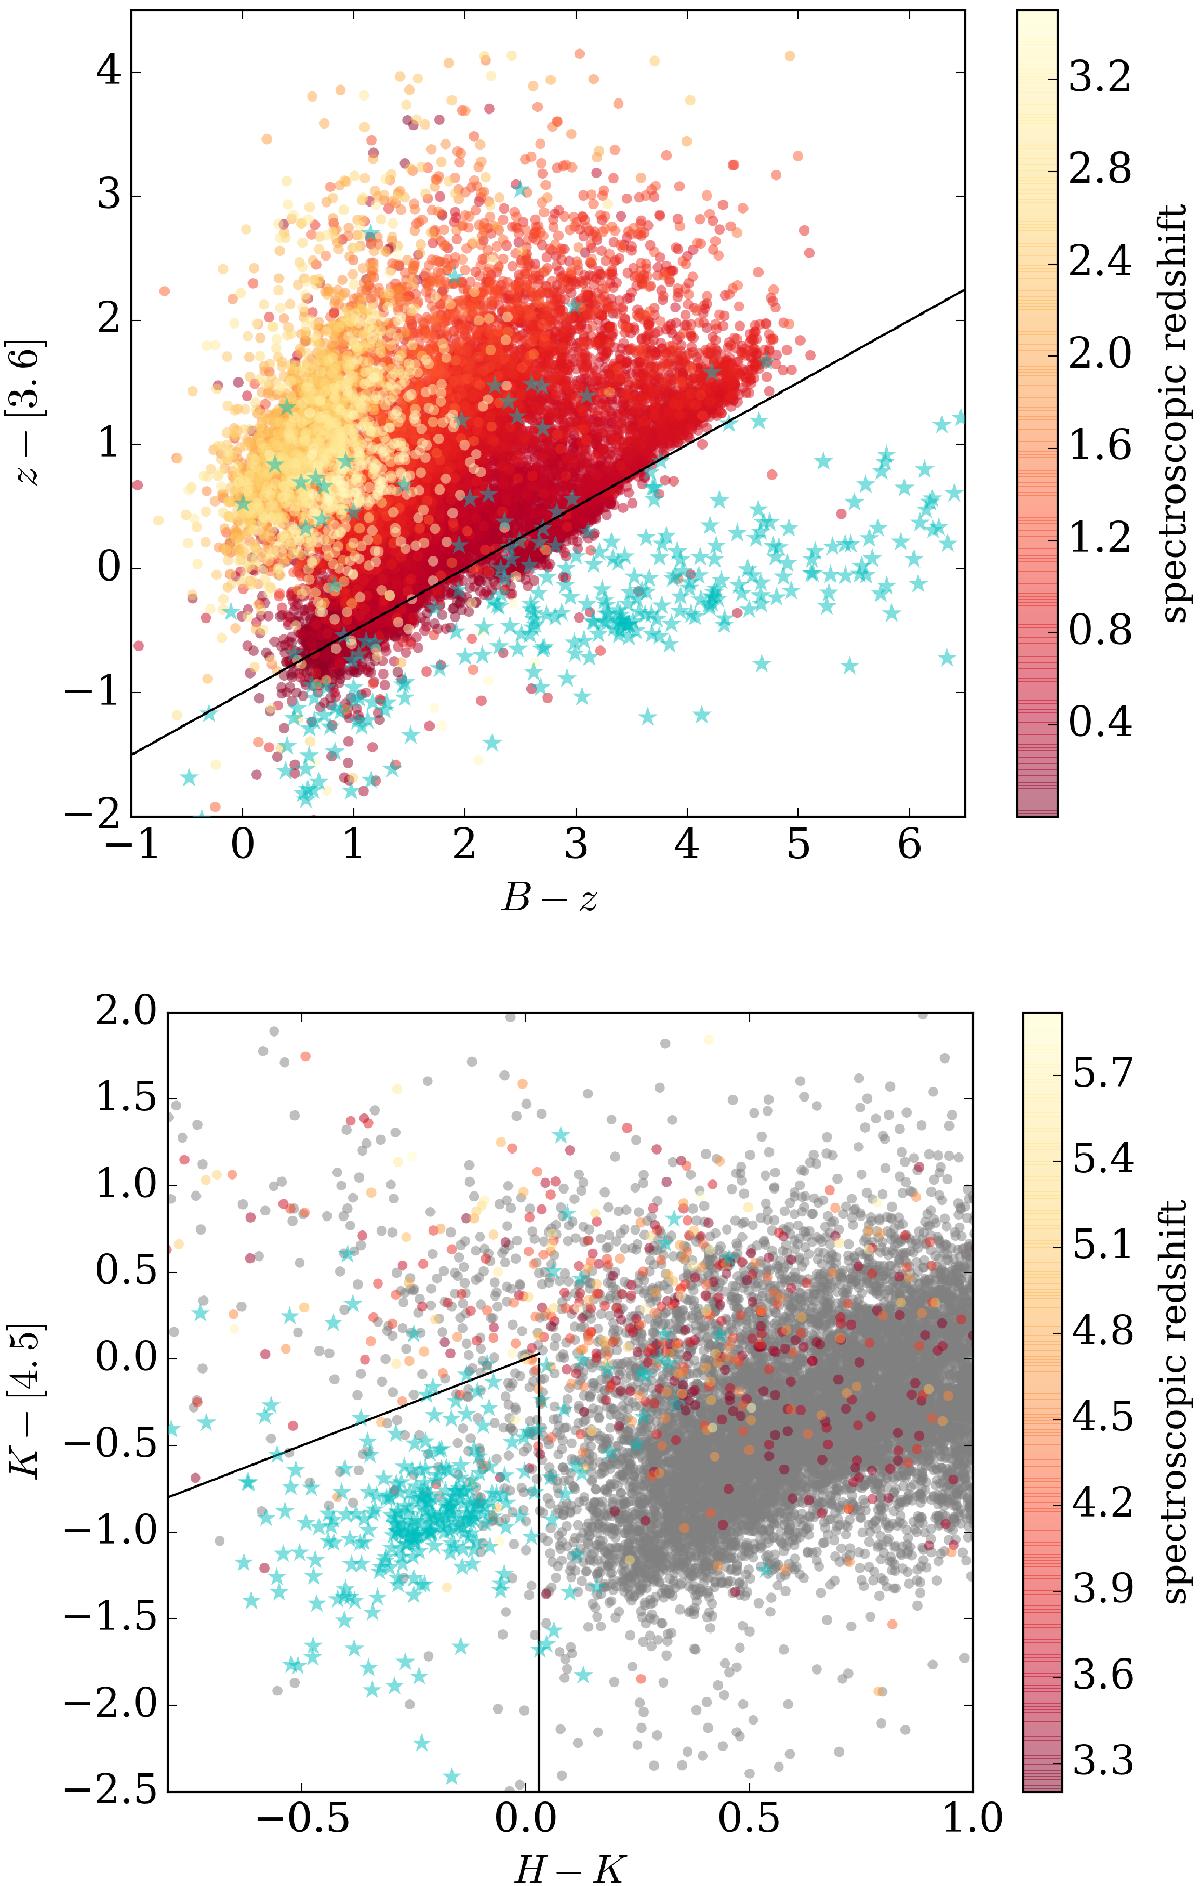
Colour-colour diagrams for removing stellar contaminants. Only spectroscopic measurements with quality flags 3 or 4 (CL >95%) are shown in the figure. Upper panel: (B−z++) vs. (z++− [3.6]). Galaxies detected in the B band are shown with filled circles coloured from red to yellow according to their zspec. Lower panel: (H−Ks) versus (Ks− [4.5]). Circles with red-to-yellow colours are B drop-outs, while grey circles are the remaining spectroscopic galaxies at z ≲ 3. In both panels, solid lines delimit the conservative boundaries we chose for the stellar locus. These are described by the following equations: (z++− [3.6] ) < 0.5(B−z++)−1 in the upper panel, and (Ks− [3.6] ) < (H−Ks) ∧ (H−Ks) < 0.03 in the lower panel. Stars spectroscopically confirmed are plotted with cyan symbols. Typical photometric errors are ≲0.05 mag for object with [3.6] < 24, and increase up to 0.08−0.12 mag for fainter ones.
Current usage metrics show cumulative count of Article Views (full-text article views including HTML views, PDF and ePub downloads, according to the available data) and Abstracts Views on Vision4Press platform.
Data correspond to usage on the plateform after 2015. The current usage metrics is available 48-96 hours after online publication and is updated daily on week days.
Initial download of the metrics may take a while.