Fig. 5

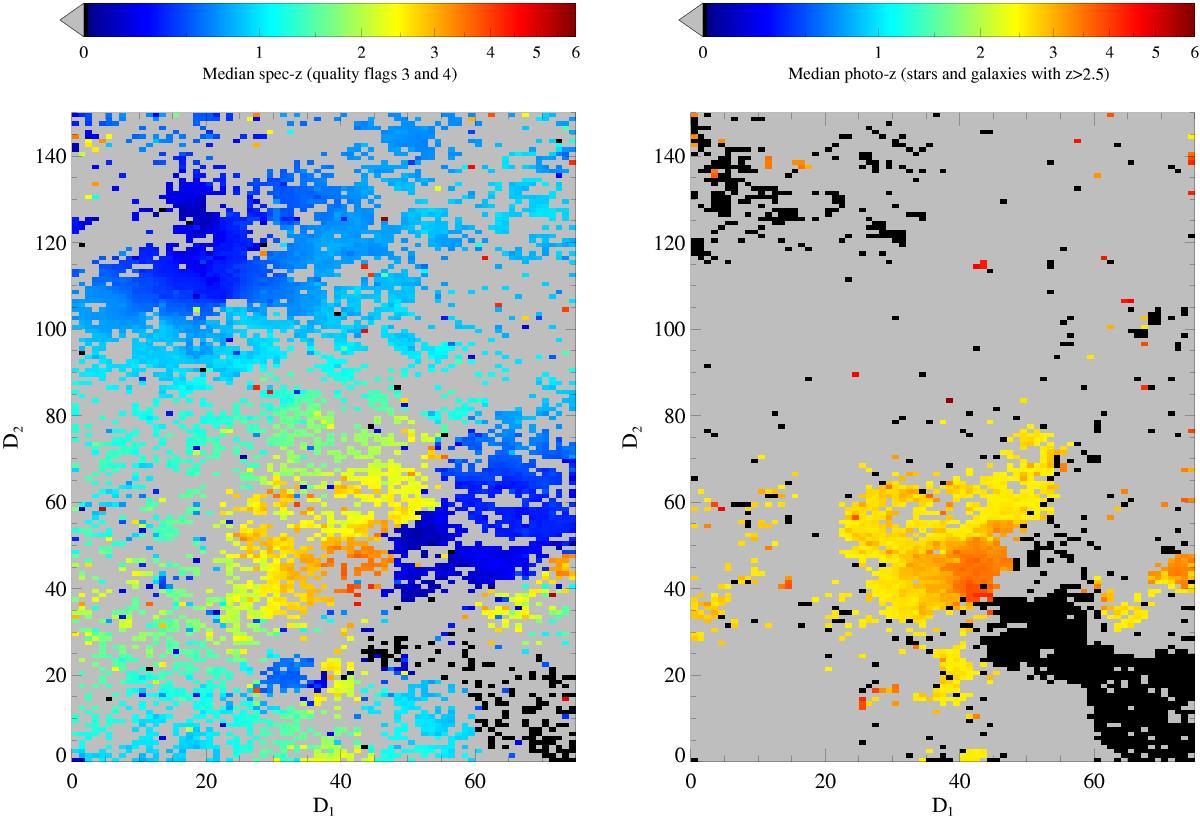
Bi-dimensional self-organising map of the COSMOS2015 catalogue (the two folded dimensions have generic labels D1 and D2). In the left panel, only robust spectroscopic objects (CL > 95%) are shown. In the right panel, the SOM is filled with photometric objects (stars and zphot> 2.5 galaxies). In both cases, each cell of the map is colour-coded according to the median redshift of the objects inside the cell (empty cells are grey, cells filled by stars are black).
Current usage metrics show cumulative count of Article Views (full-text article views including HTML views, PDF and ePub downloads, according to the available data) and Abstracts Views on Vision4Press platform.
Data correspond to usage on the plateform after 2015. The current usage metrics is available 48-96 hours after online publication and is updated daily on week days.
Initial download of the metrics may take a while.


