Fig. 6
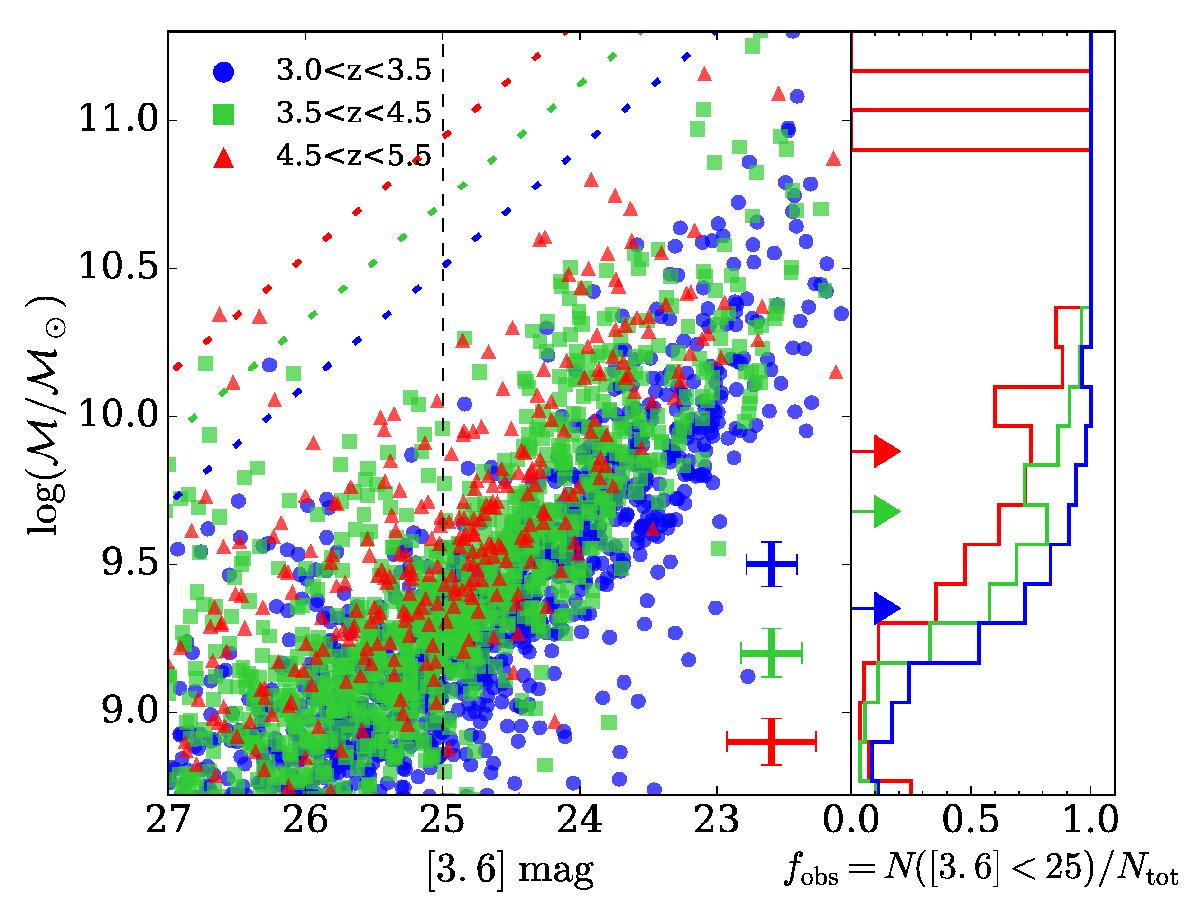
Stellar mass completeness as a function of redshift. Blue circles, green squares, and red triangles represent CANDELS galaxies at ![]() ,
, ![]() , and
, and ![]() respectively. The cut in apparent magnitude of our sample ([3.6] lim) is marked with a vertical dashed line. Slant dotted lines show a conservative estimate of the stellar mass limit, corresponding to the ℳ /L ratio of an old SSP with AV = 2 mag. Three crosses in the bottom-right corner of the main panel show the average x- and y-axis uncertainties in the corresponding bin of redshift. The histograms on the right (same colours and z-bins of the scattered points) show the ratio of N17 galaxies with [3.6] < [3.6] lim over the total N17 sample. This fraction is named fobs since they are the objects that would be observed within the magnitude limit of COSMOS2015. Below each histogram, an arrow indicates the stellar mass threshold ℳlim (see Sect. 4.2).
respectively. The cut in apparent magnitude of our sample ([3.6] lim) is marked with a vertical dashed line. Slant dotted lines show a conservative estimate of the stellar mass limit, corresponding to the ℳ /L ratio of an old SSP with AV = 2 mag. Three crosses in the bottom-right corner of the main panel show the average x- and y-axis uncertainties in the corresponding bin of redshift. The histograms on the right (same colours and z-bins of the scattered points) show the ratio of N17 galaxies with [3.6] < [3.6] lim over the total N17 sample. This fraction is named fobs since they are the objects that would be observed within the magnitude limit of COSMOS2015. Below each histogram, an arrow indicates the stellar mass threshold ℳlim (see Sect. 4.2).
Current usage metrics show cumulative count of Article Views (full-text article views including HTML views, PDF and ePub downloads, according to the available data) and Abstracts Views on Vision4Press platform.
Data correspond to usage on the plateform after 2015. The current usage metrics is available 48-96 hours after online publication and is updated daily on week days.
Initial download of the metrics may take a while.