Fig. 7
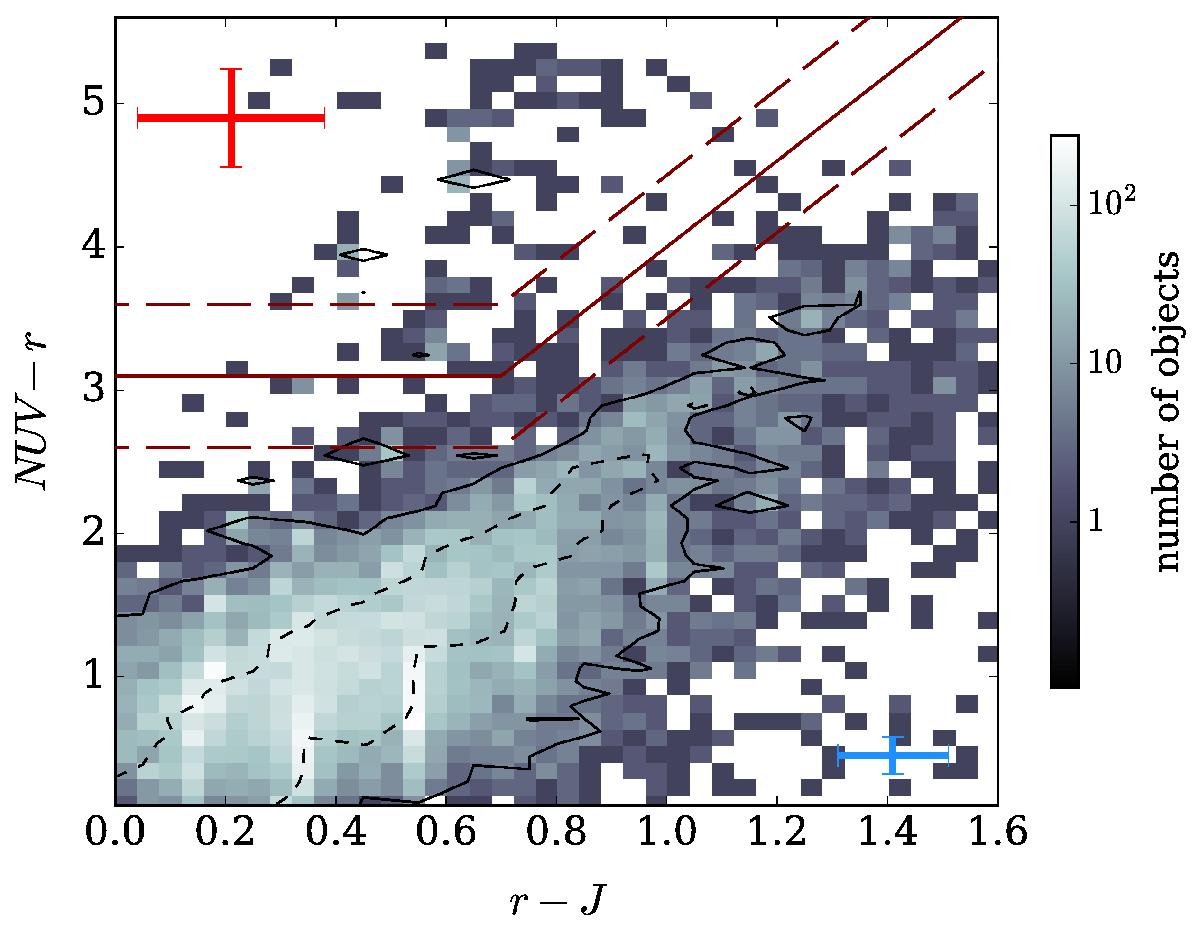
NUVrJ diagram of galaxies between z = 2.5 and 6 (with their density distribution colour-coded in grey shades). The red solid line divides active and passive regions (see Eq. (2)), while red dashed lines are shifted by ±0.5 mag from that border, to give a rough estimate of the width of the green valley, that is, the separation between active and passive clumps. The red (blue) cross in the top-left (bottom-right) corner shows the typical uncertainties σNUV−r and σr−j of passive (active) galaxies at ![]() . We also compare our fiducial estimates (based on the nearest observed filter) with colours directly derived from the template SEDs: a solid contour encloses 90% of the former distribution, while a dashed line represents the 90% envelope for the latter.
. We also compare our fiducial estimates (based on the nearest observed filter) with colours directly derived from the template SEDs: a solid contour encloses 90% of the former distribution, while a dashed line represents the 90% envelope for the latter.
Current usage metrics show cumulative count of Article Views (full-text article views including HTML views, PDF and ePub downloads, according to the available data) and Abstracts Views on Vision4Press platform.
Data correspond to usage on the plateform after 2015. The current usage metrics is available 48-96 hours after online publication and is updated daily on week days.
Initial download of the metrics may take a while.