Fig. 5
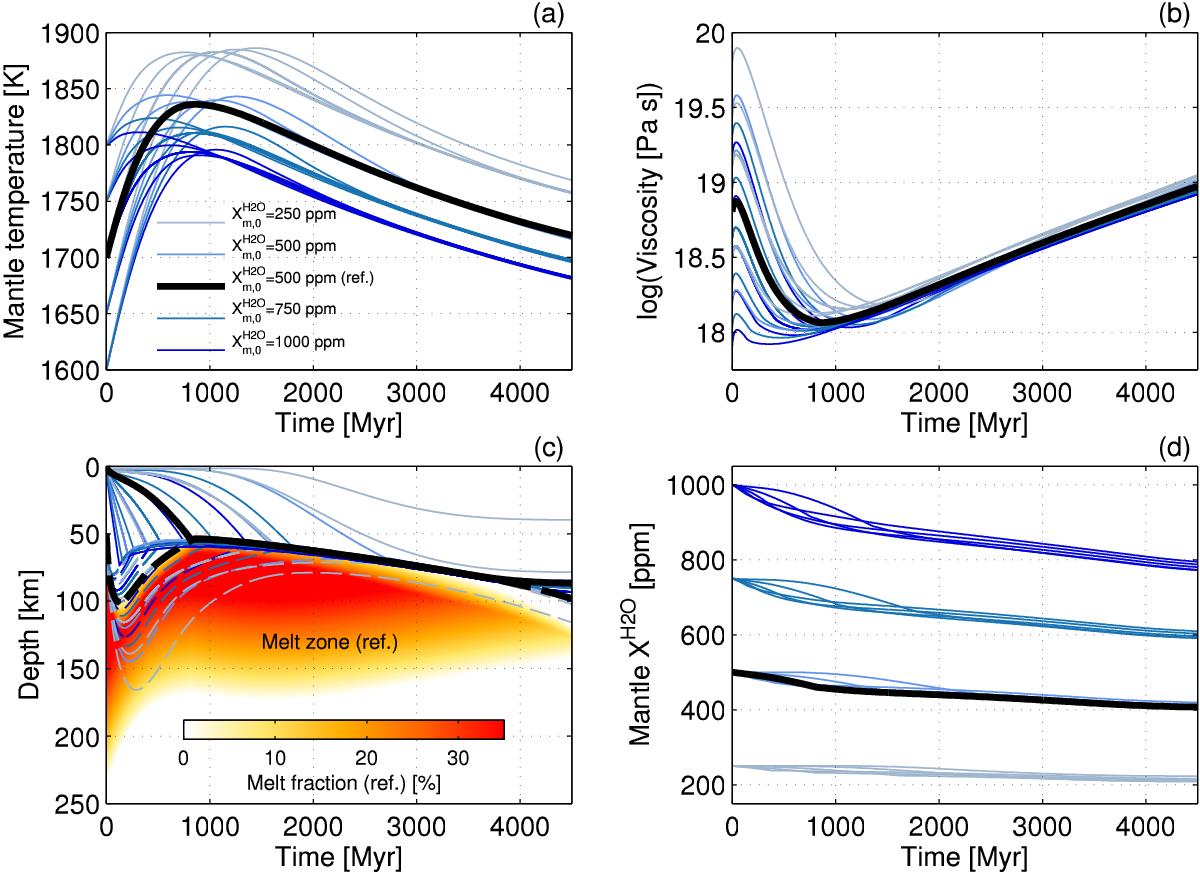
Evolution of the interior for different initial mantle temperatures between 1600 and 1800 K, initial water concentrations (![]() ) between 250 and 1000 ppm, and an oxygen fugacity corresponding to the IW buffer. Panel a: Mantle temperature is shown; b) corresponding mantle viscosity is shown; c) thickness of the crust (solid lines), the stagnant lid (dashed lines), and distribution of the melt zone and melt fraction (coloured area) are shown; and d) water concentration in the mantle is shown. The different colours, from grey to dark blue, indicate increasing initial water concentrations; the thick black lines in the four panels and the coloured melt zone in panel c indicate the reference model (ref.) with Tm,0 = 1700 K,
) between 250 and 1000 ppm, and an oxygen fugacity corresponding to the IW buffer. Panel a: Mantle temperature is shown; b) corresponding mantle viscosity is shown; c) thickness of the crust (solid lines), the stagnant lid (dashed lines), and distribution of the melt zone and melt fraction (coloured area) are shown; and d) water concentration in the mantle is shown. The different colours, from grey to dark blue, indicate increasing initial water concentrations; the thick black lines in the four panels and the coloured melt zone in panel c indicate the reference model (ref.) with Tm,0 = 1700 K, ![]() ppm, and fO2 at the IW buffer. The different initial mantle temperatures, which can be identified in panel a, are not indicated with distinct colours.
ppm, and fO2 at the IW buffer. The different initial mantle temperatures, which can be identified in panel a, are not indicated with distinct colours.
Current usage metrics show cumulative count of Article Views (full-text article views including HTML views, PDF and ePub downloads, according to the available data) and Abstracts Views on Vision4Press platform.
Data correspond to usage on the plateform after 2015. The current usage metrics is available 48-96 hours after online publication and is updated daily on week days.
Initial download of the metrics may take a while.