Fig. 3
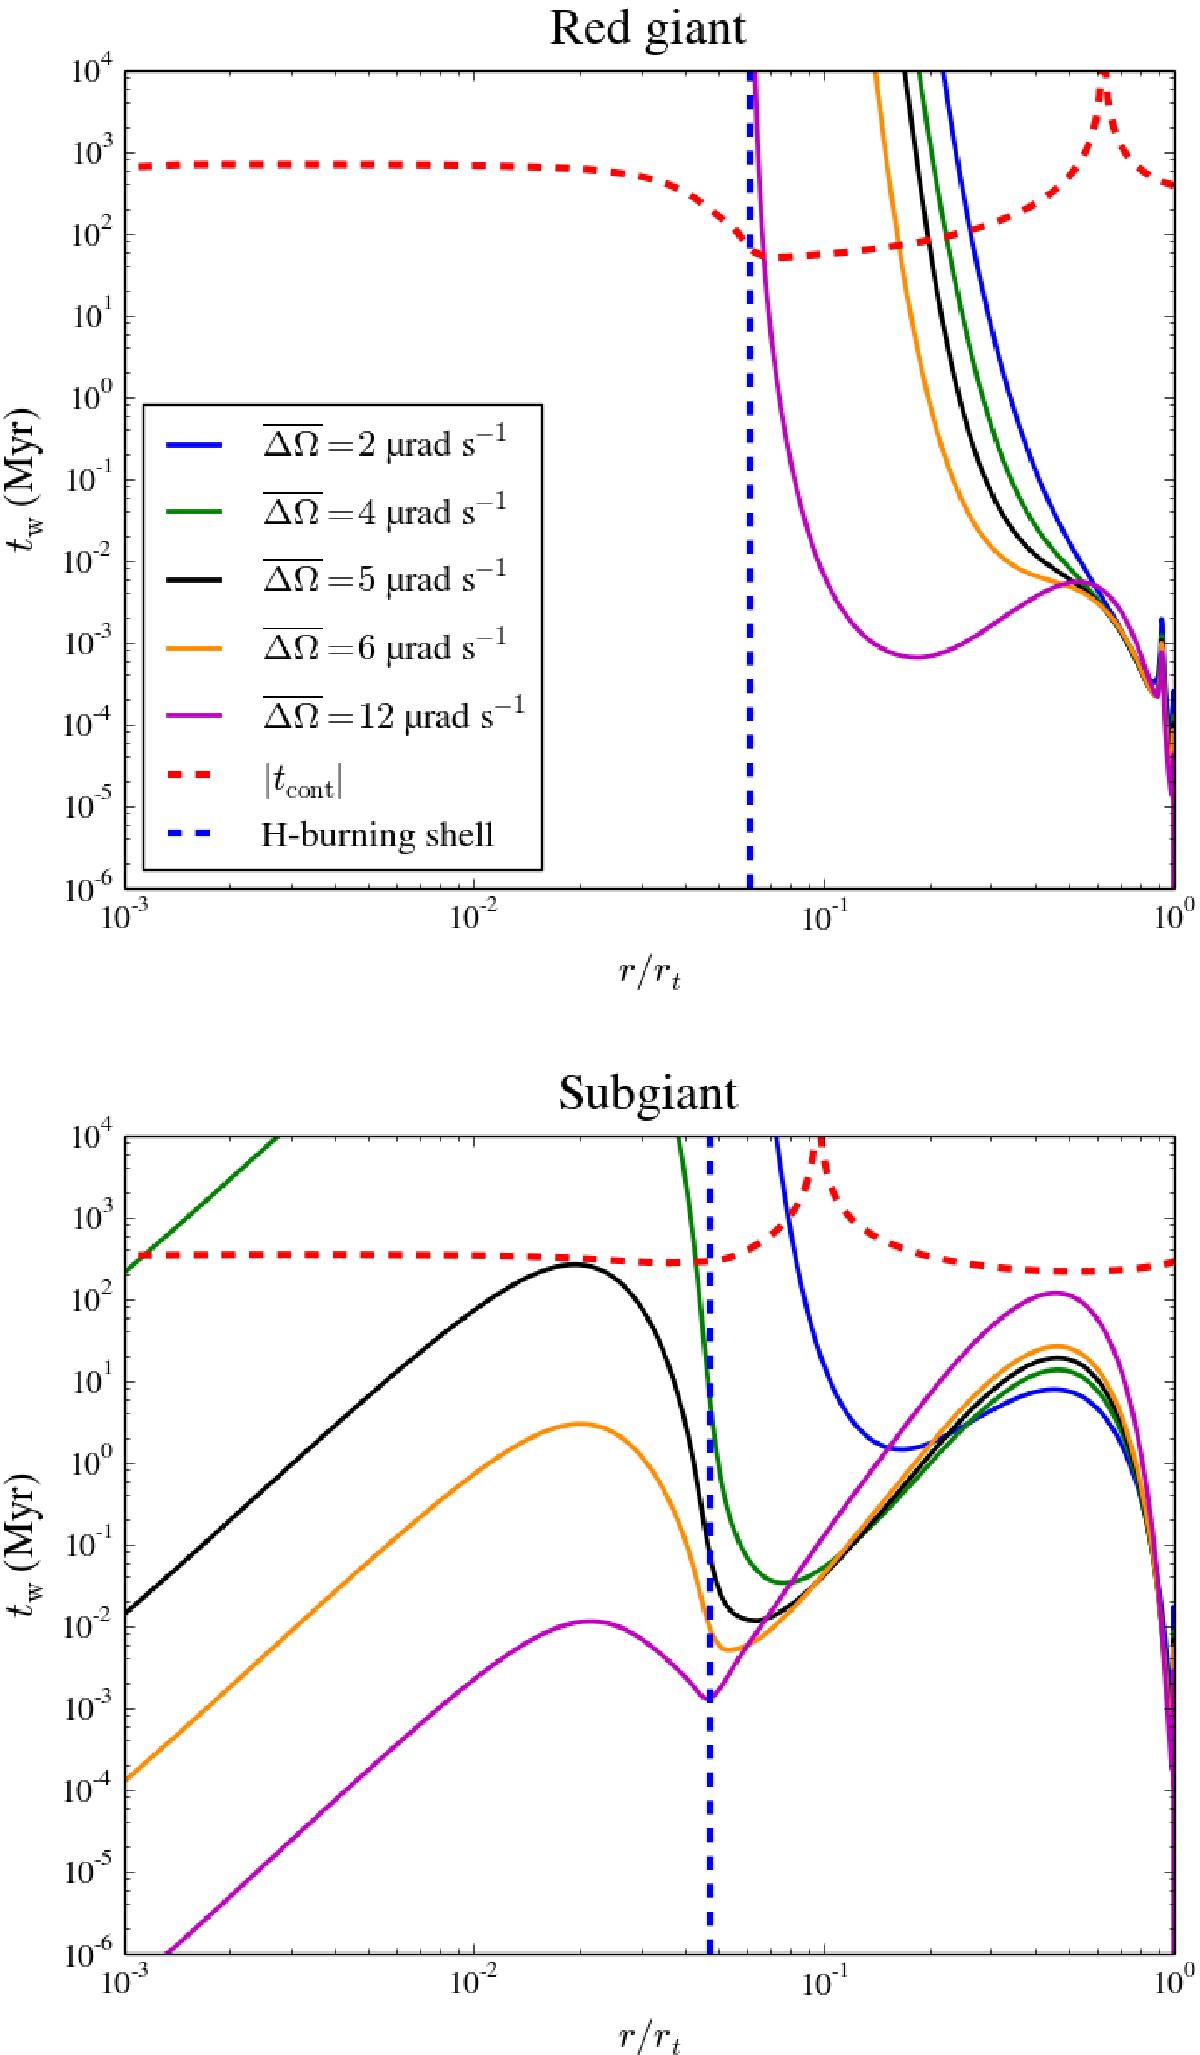
Top: characteristic wave-related timescale (solid lines), computed using Eq. (4), as a function of the normalized radius in the radiative zone of a 1 M⊙ red giant model, with log Teff = 3.16 and log L/L⊙ = 0.92. Colors correspond to different values for the amplitude of the differential rotation, ![]() . The red and the blue dashed lines represent the contraction or dilatation timescale and the location of the hydrogen-burning shell, respectively. Bottom: same caption and legend as the top panel, but for a 1 M⊙ subgiant model, with log Teff = 3.70 and log L/L⊙ = 0.35.
. The red and the blue dashed lines represent the contraction or dilatation timescale and the location of the hydrogen-burning shell, respectively. Bottom: same caption and legend as the top panel, but for a 1 M⊙ subgiant model, with log Teff = 3.70 and log L/L⊙ = 0.35.
Current usage metrics show cumulative count of Article Views (full-text article views including HTML views, PDF and ePub downloads, according to the available data) and Abstracts Views on Vision4Press platform.
Data correspond to usage on the plateform after 2015. The current usage metrics is available 48-96 hours after online publication and is updated daily on week days.
Initial download of the metrics may take a while.