Free Access
Fig. A.1
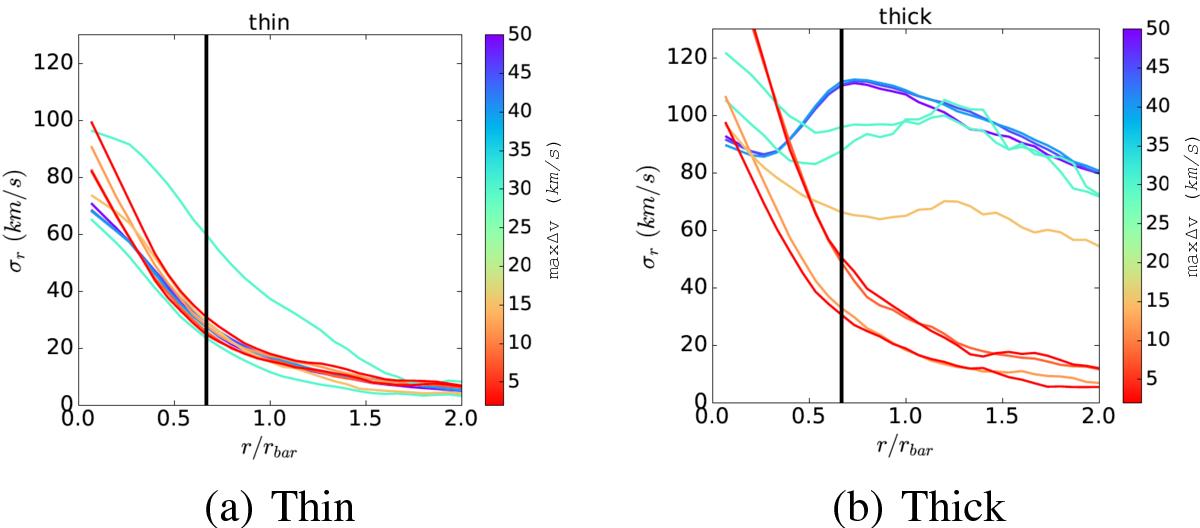
Initial radial velocity dispersion σr of the thin (left) and thick disc (right) for a number of test simulations, which were used to construct Fig. 16. The colour-coding corresponds to the colour bar in Fig. 16, i.e. according to the maximum Δv of the model. The vertical black line indicates the end of the b/p bulge.
This figure is made of several images, please see below:
Current usage metrics show cumulative count of Article Views (full-text article views including HTML views, PDF and ePub downloads, according to the available data) and Abstracts Views on Vision4Press platform.
Data correspond to usage on the plateform after 2015. The current usage metrics is available 48-96 hours after online publication and is updated daily on week days.
Initial download of the metrics may take a while.