Fig. 2
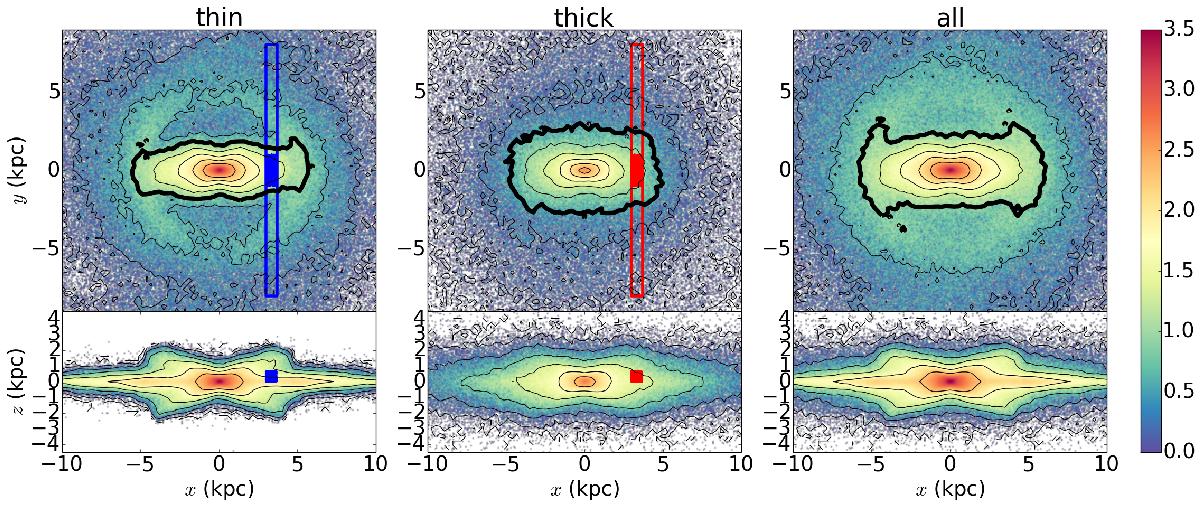
Surface density maps for the thin and thick disc stars (first and second columns, respectively) and all the stars in the disc (third column). The top panels show the xy (face-on) projection and the bottom panels show the xz (edge-on) projection of surface density. The blue and red shaded and unshaded regions indicate the selected particles at the end of the bar discussed in Sect. 5 and in Figs. 14 and 15 (see text).
Current usage metrics show cumulative count of Article Views (full-text article views including HTML views, PDF and ePub downloads, according to the available data) and Abstracts Views on Vision4Press platform.
Data correspond to usage on the plateform after 2015. The current usage metrics is available 48-96 hours after online publication and is updated daily on week days.
Initial download of the metrics may take a while.