Fig. 7
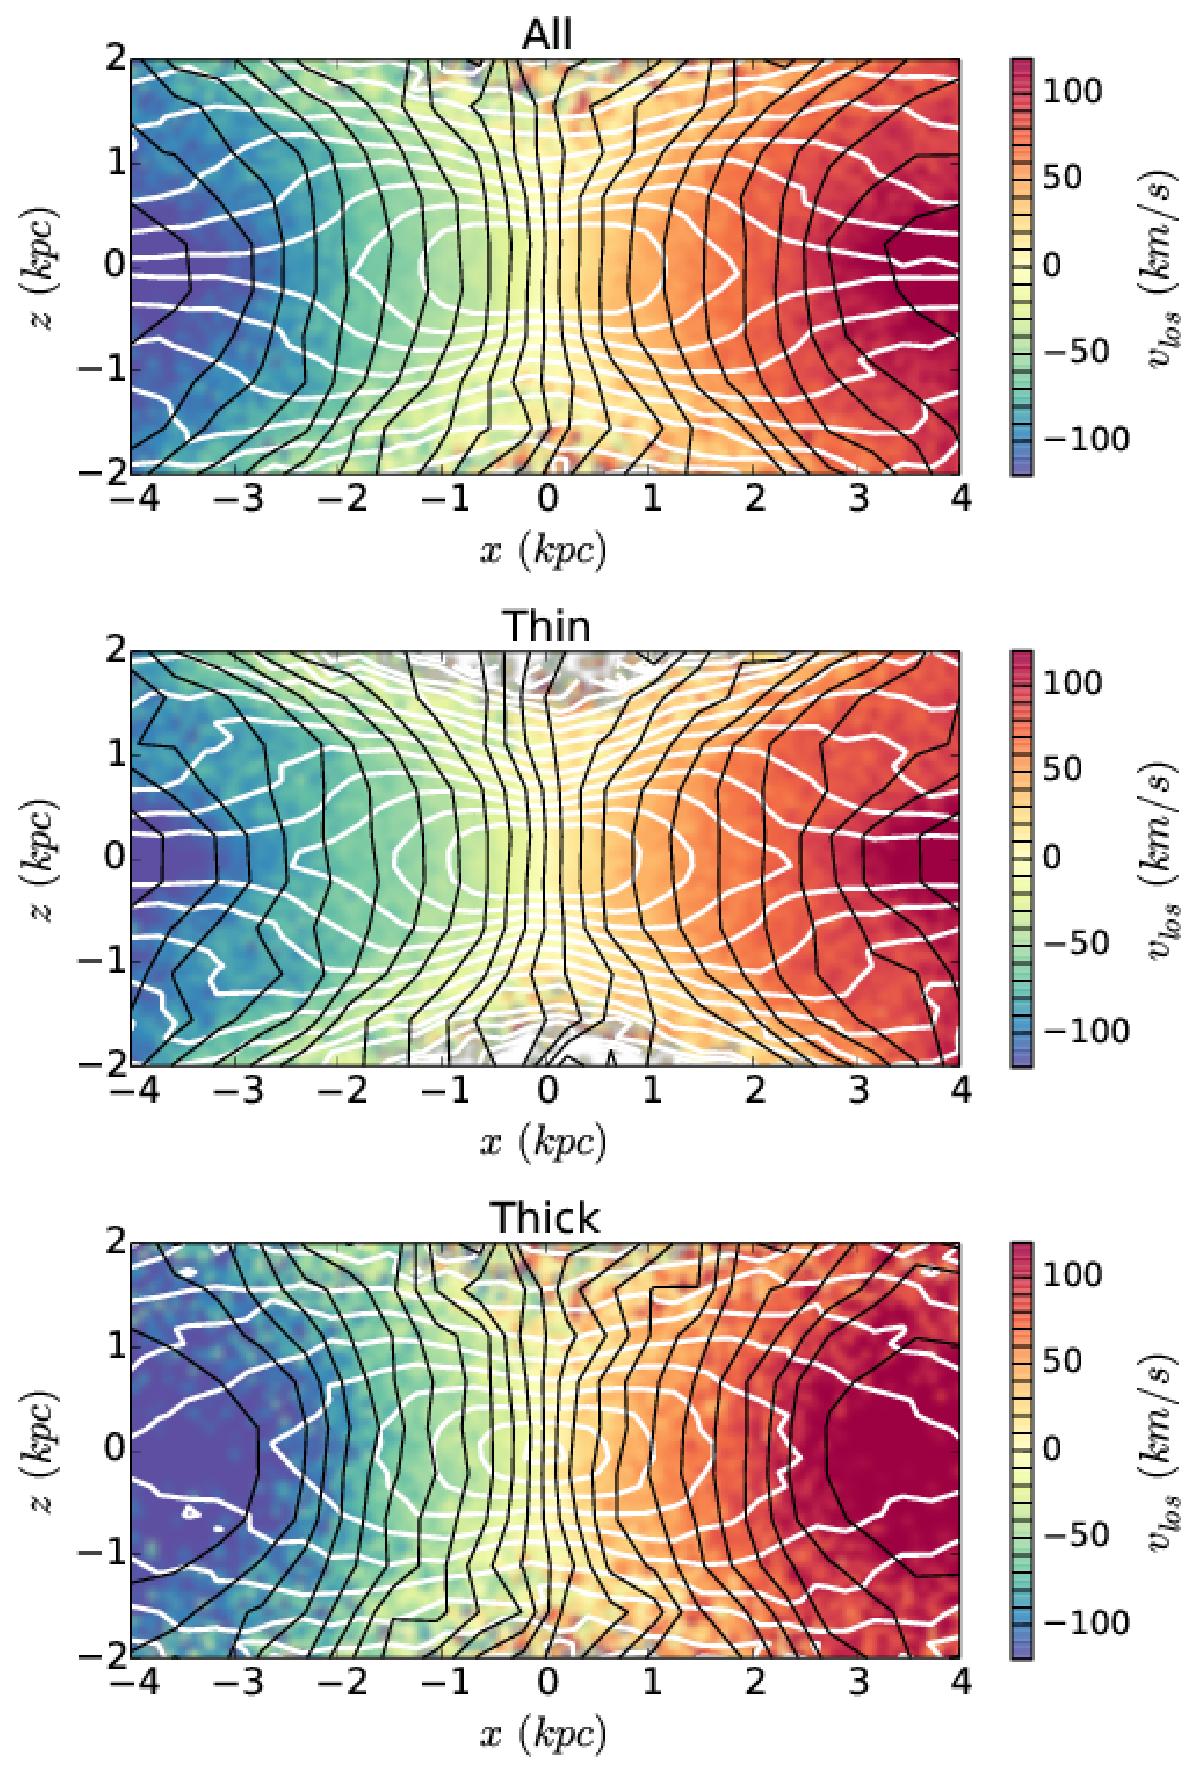
Two-dimensional velocity field of all the stars (top), of the thin disc stars (middle), and of the thick disc stars (bottom) in the fiducial simulation after 9 Gyr of evolution after the bar and b/p have formed. The white contours show the surface density of each component, while the black isovelocity contours are plotted at intervals of 10 km s-1.
Current usage metrics show cumulative count of Article Views (full-text article views including HTML views, PDF and ePub downloads, according to the available data) and Abstracts Views on Vision4Press platform.
Data correspond to usage on the plateform after 2015. The current usage metrics is available 48-96 hours after online publication and is updated daily on week days.
Initial download of the metrics may take a while.