Fig. 8
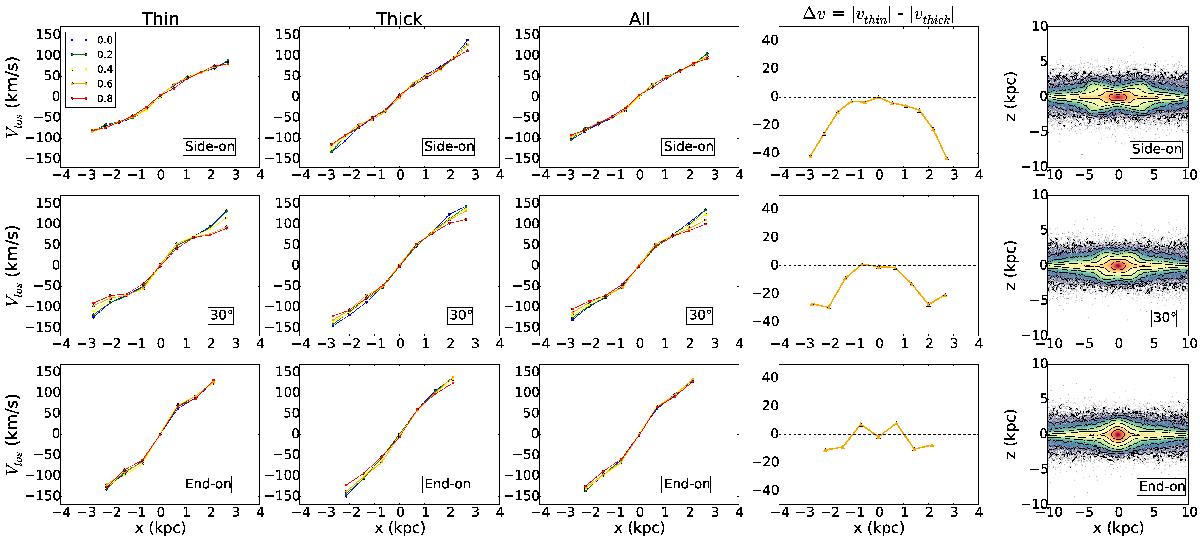
Line-of-sight velocity for “slits” at different heights above the plane, as indicated in the top left inset, for three orientations of the bar, side-on (bar semi-major axis at 90 degrees to the los, top row), 30 degrees to the line of sight (similar to the Milky Way orientation, middle row) and end-on (bar at 0 degrees to the los, bottom row). The first column shows the los velocity of the thin disc stars, the second column the thick disc stars, and the third column gives the los velocity for all the stars. The fourth column shows the average difference Δv between the thin and thick disc los velocities (see Eq. (6)). The fifth column shows the surface density of the simulation for the given orientation. For side-on and Milky Way-like orientations the thick disc has higher los velocities than the thin disc.
Current usage metrics show cumulative count of Article Views (full-text article views including HTML views, PDF and ePub downloads, according to the available data) and Abstracts Views on Vision4Press platform.
Data correspond to usage on the plateform after 2015. The current usage metrics is available 48-96 hours after online publication and is updated daily on week days.
Initial download of the metrics may take a while.