Fig. 1
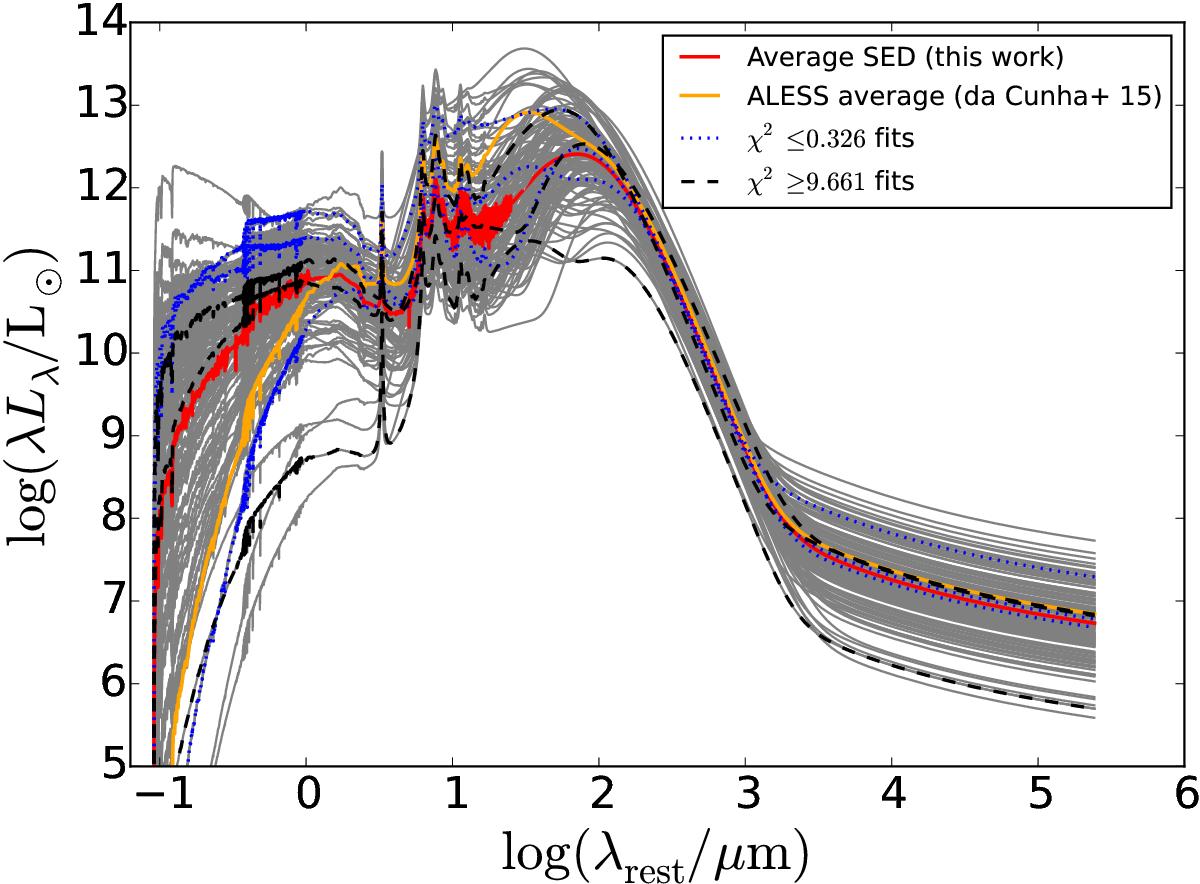
Best-fit panchromatic (UV–radio) rest-frame SEDs of all the 124 analysed SMGs (grey lines). The three best SED fits (χ2 ≤ 0.326) are highlighted by the blue dotted lines, while the three worst SEDs (χ2 ≥ 9.661) are shown by the black dashed lines. The red line shows the average SED of our SMGs, while the orange line shows the average MAGPHYS SED of the 870 μm selected SMGs from da Cunha et al. (2015; cf. their Fig. 11). See Sect. 4.8 for further discussion.
Current usage metrics show cumulative count of Article Views (full-text article views including HTML views, PDF and ePub downloads, according to the available data) and Abstracts Views on Vision4Press platform.
Data correspond to usage on the plateform after 2015. The current usage metrics is available 48-96 hours after online publication and is updated daily on week days.
Initial download of the metrics may take a while.