Fig. 10
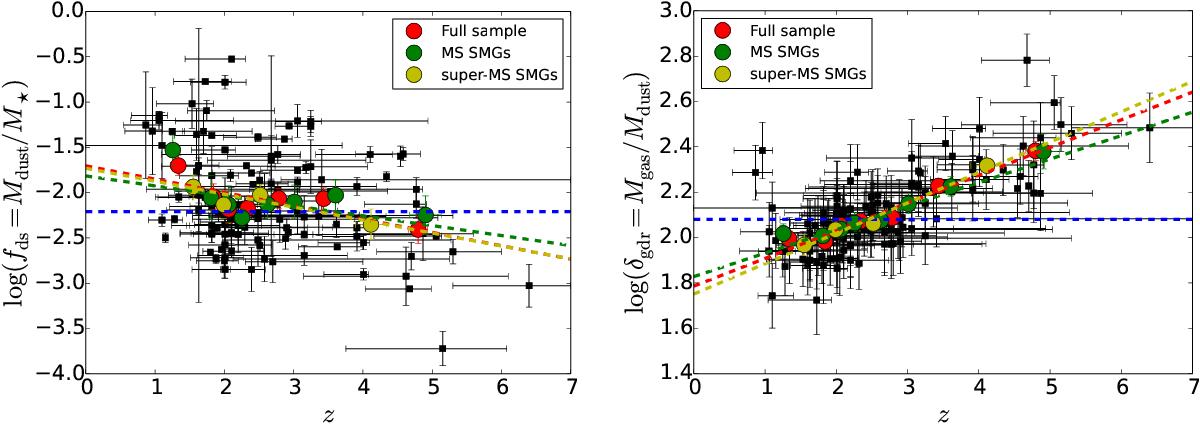
Dust-to-stellar mass ratio (left) and gas-to-dust mass ratio (right) as a function of redshift. The red, green, and yellow filled circles show the binned averages as in the left panel in Fig. 8. In the left panel, the blue horizontal dashed line marks the sample median Mdust/M⋆ ratio of 0.006, while that in the right panel shows the median Mgas/Mdust ratio of 120. The other dashed lines show the linear fits through the binned data points (see text for details).
Current usage metrics show cumulative count of Article Views (full-text article views including HTML views, PDF and ePub downloads, according to the available data) and Abstracts Views on Vision4Press platform.
Data correspond to usage on the plateform after 2015. The current usage metrics is available 48-96 hours after online publication and is updated daily on week days.
Initial download of the metrics may take a while.