Fig. 13
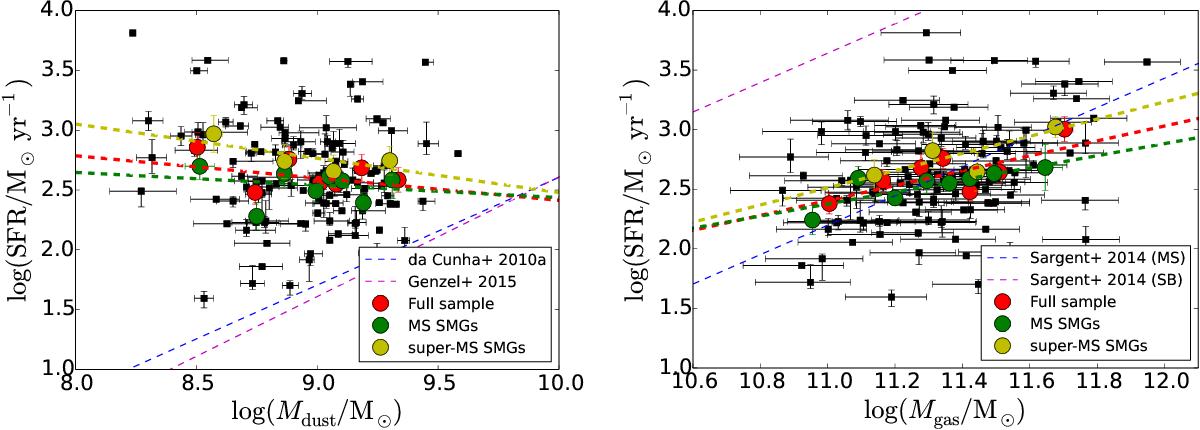
Star formation rate as a function of dust mass (left panel) and gas mass (right panel; the so-called integrated K-S diagram). In both panels, the red, green, and yellow filled circles represent the mean values of the binned data as in the left panel in Fig. 8. The blue dashed line in the left panel shows the da Cunha et al. (2010a) relationship, that is SFR [M⊙ yr-1] = 3.95 × 10⁻⁷ × (Mdust/M⊙)0.9. The magenta dashed line in the left panel shows the Mdust−Tdust−SFR scaling relation from Genzel et al. (2015; Eq. (9) therein), which is here plotted at Tdust = 25 K. In the right panel, the blue and magenta dashed lines show the relationships calibrated for MS and starburst galaxies by Sargent et al. (2014; their Eq. (4)).
Current usage metrics show cumulative count of Article Views (full-text article views including HTML views, PDF and ePub downloads, according to the available data) and Abstracts Views on Vision4Press platform.
Data correspond to usage on the plateform after 2015. The current usage metrics is available 48-96 hours after online publication and is updated daily on week days.
Initial download of the metrics may take a while.