Fig. 14
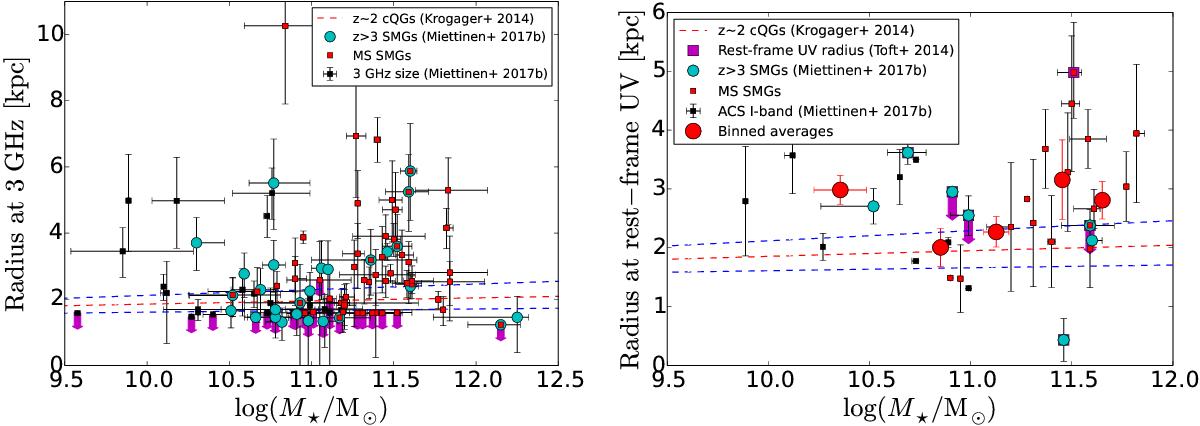
Radii of our SMGs plotted against their stellar masses. In the left panel, we plot the observed-frame 3 GHz radio-emitting sizes (defined as half the deconvolved major axis FWHM) from Miettinen et al. (2017b). In the right panel, we plot the radii at the rest-frame UV, which are based on observations with the Hubble/ACS in the I-band (see Miettinen et al. 2017b, and references therein). These data are supplemented by the rest-frame UV sizes measured by Toft et al. (2014; scaled to the present redshifts and cosmology). In both panels, the MS SMGs are highlighted by small red squares, while those SMGs that lie at z> 3 are highlighted by filled cyan circles. The upper size limits are indicated by downwards-pointing magenta arrows. In the right panel, the large red circles represent the survival analysis-based mean values of the binned data (each bin is equally populated by six SMGs, except the highest stellar mass bin, which contains seven SMGs), with the error bars showing the standard errors of the mean values. The three dashed lines in both panels show the mass-size relationship of z ~ 2 cQGs from Krogager et al. (2014), where the blue dashed lines represent the dispersion in the parameters (see text for details). We note that the plotting ranges are different in the left and right panels.
Current usage metrics show cumulative count of Article Views (full-text article views including HTML views, PDF and ePub downloads, according to the available data) and Abstracts Views on Vision4Press platform.
Data correspond to usage on the plateform after 2015. The current usage metrics is available 48-96 hours after online publication and is updated daily on week days.
Initial download of the metrics may take a while.