Fig. 15
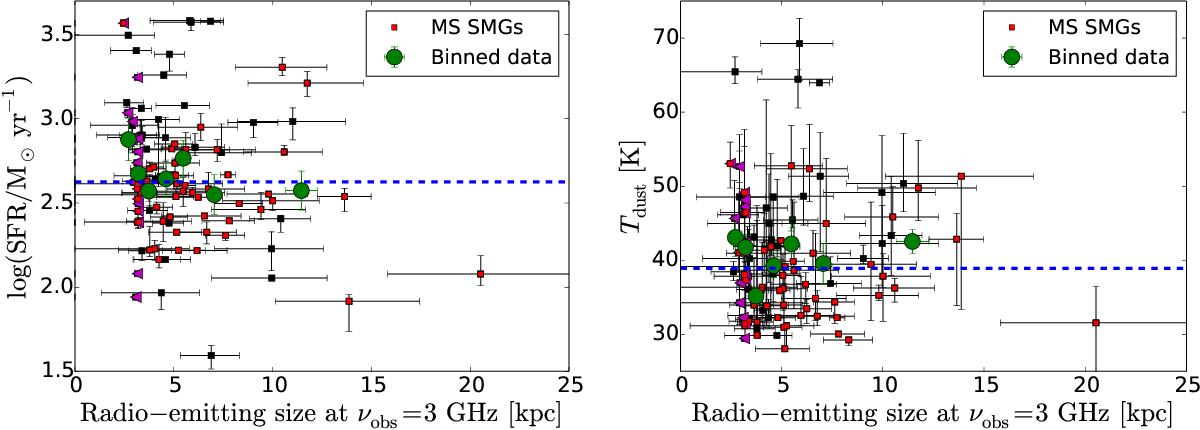
Star formation rate (left) and Tdust (right) plotted as a function of the size of the radio-emitting region (FWHM of the deconvolved major axis in kpc) at νobs = 3 GHz derived by Miettinen et al. (2017b). The MS SMGs are highlighted by red markers. The left-pointing magenta triangles indicate the upper size limits, while the green filled circles represent the survival-analysis based mean values of the binned data (each bin contains 14 SMGs), with the error bars showing the standard errors of the mean values. In both panels, the horizontal blue dashed line marks the median value of the y-axis parameter for the 98 analysed SMGs (SFR = 423M⊙ yr-1 and Tdust = 38.9 K).
Current usage metrics show cumulative count of Article Views (full-text article views including HTML views, PDF and ePub downloads, according to the available data) and Abstracts Views on Vision4Press platform.
Data correspond to usage on the plateform after 2015. The current usage metrics is available 48-96 hours after online publication and is updated daily on week days.
Initial download of the metrics may take a while.