Fig. 16
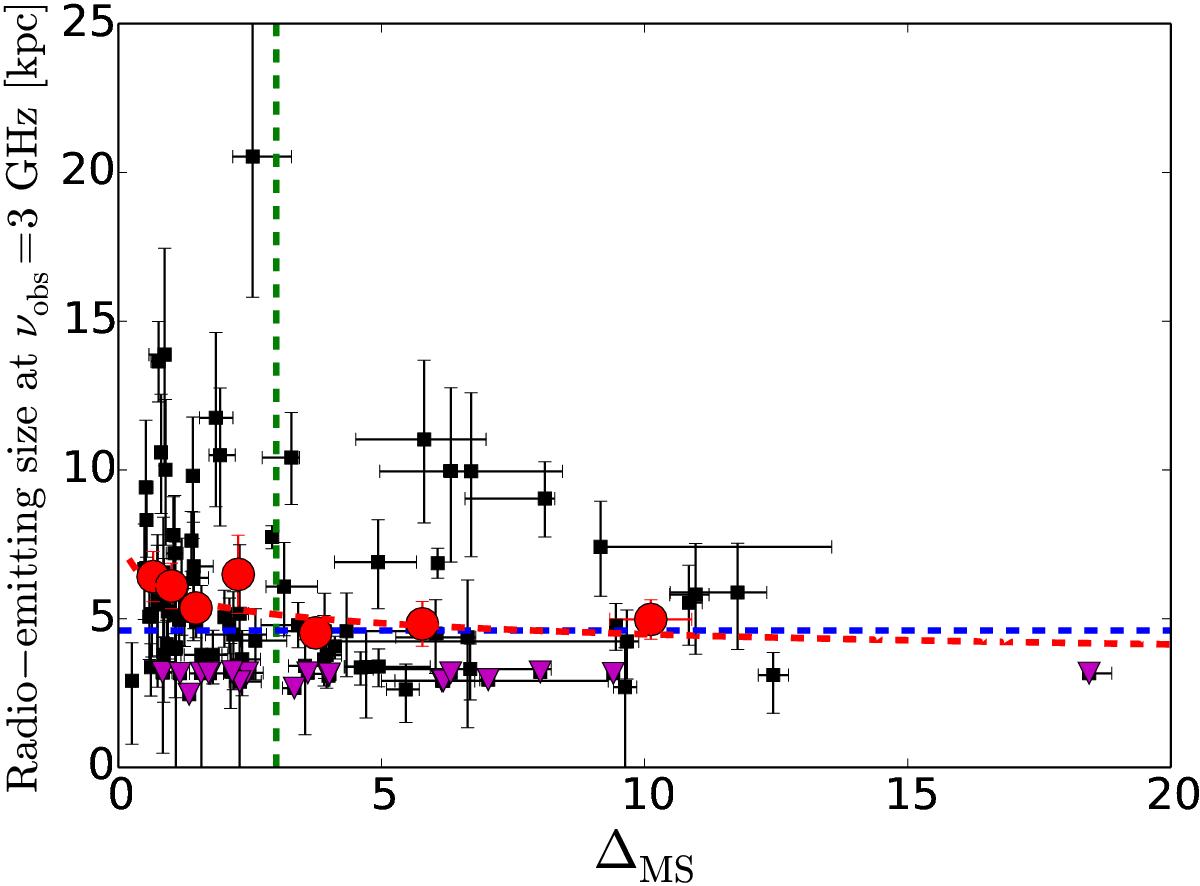
Radio-emitting size at νobs = 3 GHz (deconvolved FWHM of the majoar axis in kpc) from Miettinen et al. (2017b) as a function of the deviation from the MS. The down-pointing magenta triangles indicate the upper size limits, while the red filled circles represent the binned averages as in Fig. 15. The red, dashed curve represents a least squares fit to the mean data points (see text for details). The horizontal blue, dashed line marks the survival analysis-based median radio size of 4.6 kpc for the plotted sample. The vertical green, dashed line shows the upper boundary limit of the MS, that is ΔMS = 3.
Current usage metrics show cumulative count of Article Views (full-text article views including HTML views, PDF and ePub downloads, according to the available data) and Abstracts Views on Vision4Press platform.
Data correspond to usage on the plateform after 2015. The current usage metrics is available 48-96 hours after online publication and is updated daily on week days.
Initial download of the metrics may take a while.