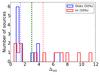
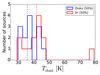
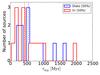
Fig. 17
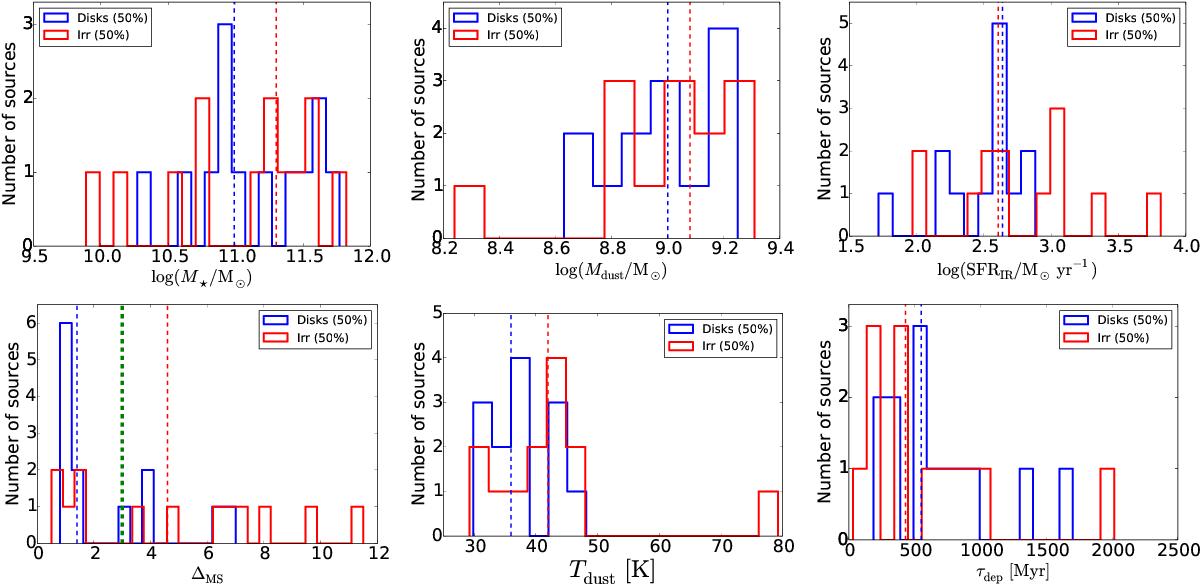
From left to right, top to bottom: distributions of M⋆, Mdust, SFR, ΔMS, Tdust, and τdep for our SMGs that are classified as disks and irregular galaxies (see text and Miettinen et al. 2017b, for details). The blue and red vertical dashed lines show the sample medians (disks: M⋆ = 9.8 × 10¹⁰M⊙, Mdust = 1.0 × 10⁹M⊙, SFR = 434M⊙ yr-1, ΔMS = 1.4, Tdust = 36 K, and τdep = 549 Myr; irregulars: M⋆ = 2.0 × 10¹¹M⊙, Mdust = 1.2 × 10⁹M⊙, SFR = 404M⊙ yr-1, ΔMS = 4.6, Tdust = 42 K, and τdep = 429 Myr). In the bottom left panel, the vertical green dashed line marks the upper boundary of the adopted MS definition, that is ΔMS = 3.
Current usage metrics show cumulative count of Article Views (full-text article views including HTML views, PDF and ePub downloads, according to the available data) and Abstracts Views on Vision4Press platform.
Data correspond to usage on the plateform after 2015. The current usage metrics is available 48-96 hours after online publication and is updated daily on week days.
Initial download of the metrics may take a while.