Fig. 18
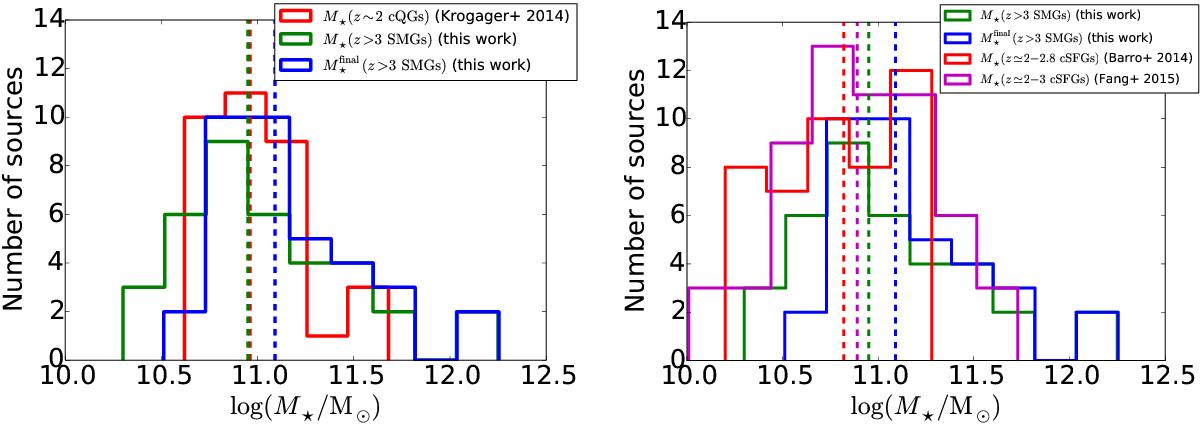
Left: stellar mass distribution of our z> 3 SMGs (green histogram), and z ~ 2 cQGs (Krogager et al. 2014; red histogram). The blue histogram shows the distribution of the estimated final stellar masses of our z> 3 SMGs by assuming that 10% of their putative gas mass content (Mgas derived in Sect. 3.2) is converted into stars by the end of the rapid star formation event. The vertical dashed lines mark the median mass values. Right: the green and blue histograms are as in the left panel, while the red and magenta histograms show the stellar mass distributions of cSFGs from Barro et al. (2014) and Fang et al. (2015), respectively.
Current usage metrics show cumulative count of Article Views (full-text article views including HTML views, PDF and ePub downloads, according to the available data) and Abstracts Views on Vision4Press platform.
Data correspond to usage on the plateform after 2015. The current usage metrics is available 48-96 hours after online publication and is updated daily on week days.
Initial download of the metrics may take a while.