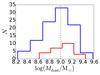
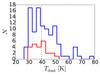
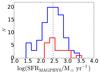
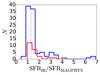
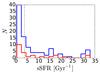
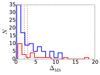
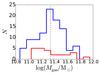
Fig. 2
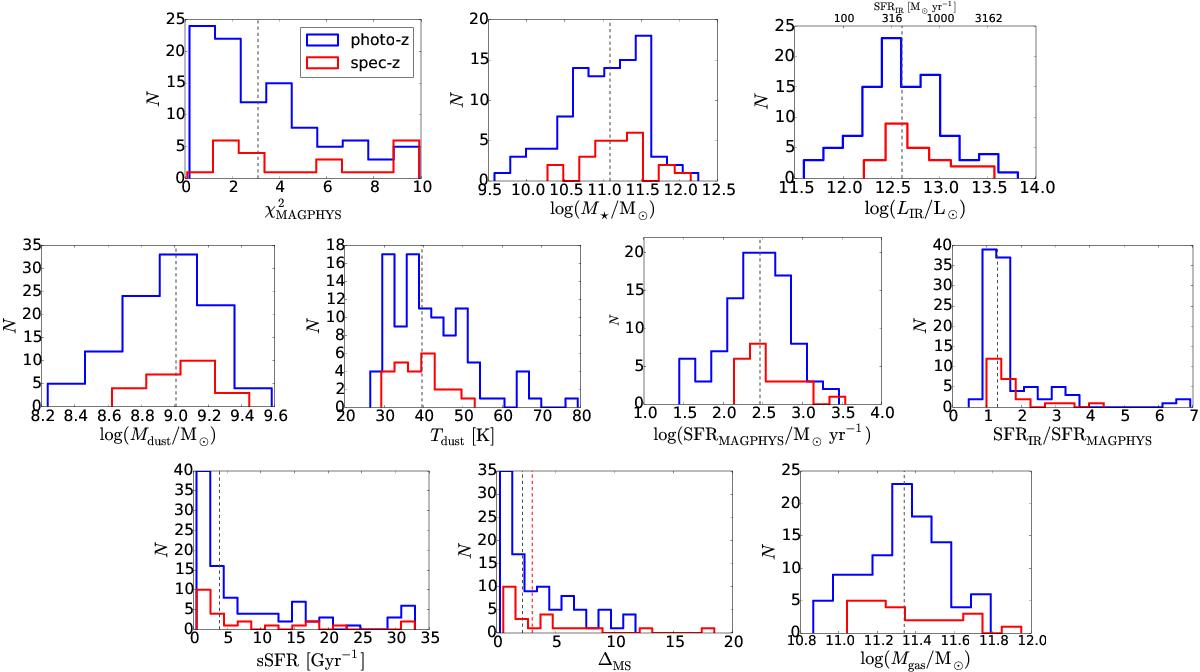
Distributions of the MAGPHYS SED results and other physical parameters, shown separately for the spectroscopically confirmed sources (red histogram) and the sources with photometric redshifts (blue histogram). The panels from top to bottom, left to right, show the χ2 (goodness of fit) values of the best-fit MAGPHYS SEDs, stellar masses, total-IR luminosities (the upper x-axis shows the corresponding LIR-based SFRs), dust masses, dust temperatures, MAGPHYS-derived SFRs (Δt = 100 Myr), ratios between the LIR-based SFR and that directly output by MAGPHYS, specific SFRs, starburstiness parameters (distance from the MS mid-line; see Sect. 4.1), and the ALMA 1.3 mm-based gas masses (Sect. 3.2). Base-10 logarithms are used for the masses, LIR, and MAGPHYS-derived SFRs. The vertical dashed lines mark the full sample medians (see Table 1), and the additional red vertical line in the starburstiness panel shows the upper boundary of the MS (i.e. ΔMS = 3, above which the source can be defined as a starburst galaxy).
Current usage metrics show cumulative count of Article Views (full-text article views including HTML views, PDF and ePub downloads, according to the available data) and Abstracts Views on Vision4Press platform.
Data correspond to usage on the plateform after 2015. The current usage metrics is available 48-96 hours after online publication and is updated daily on week days.
Initial download of the metrics may take a while.