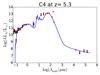
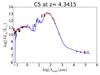
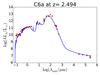
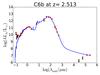
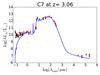
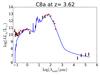
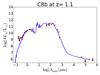
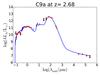
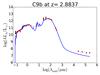
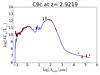
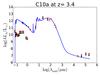
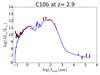
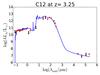
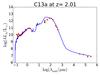
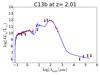
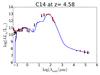
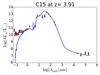
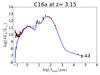
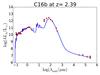
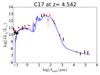
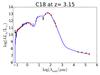
Fig. A.1
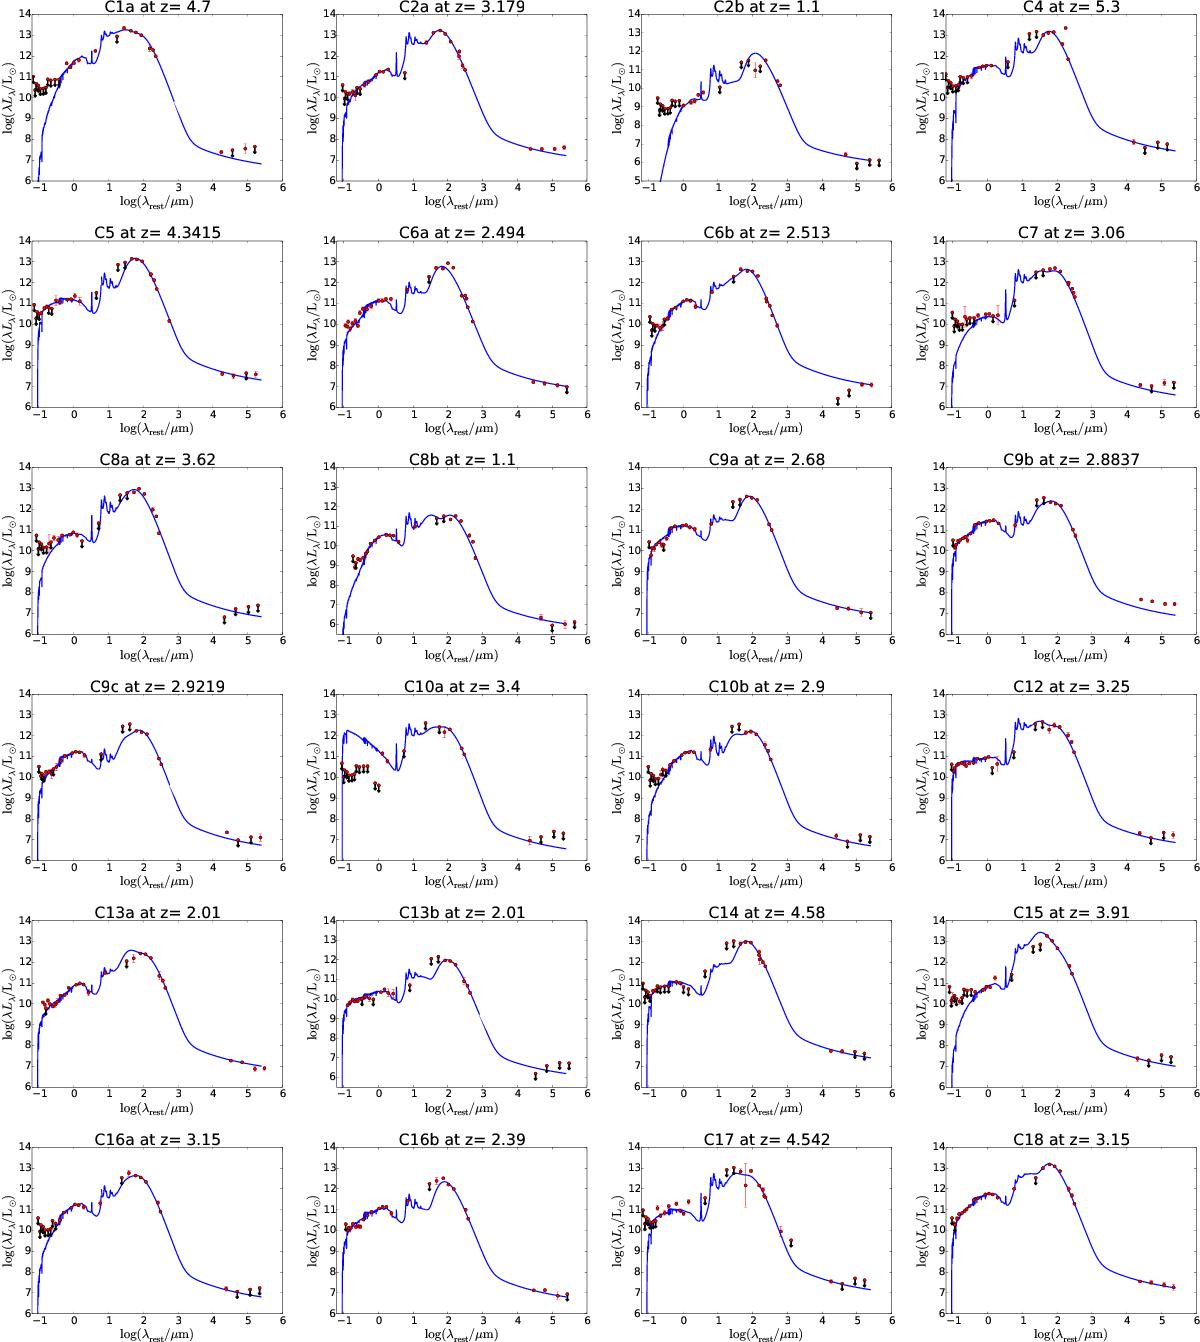
Best-fit panchromatic (UV-radio) rest-frame SEDs of our SMGs. The source ID and redshift are shown on top of each panel. The red points with vertical error bars represent the observed photometric data, and those with downwards pointing arrows mark the 3σ upper flux density limits (taken into account in the fits). The blue line is the best-fit MAGPHYS model SED from the high-z library (da Cunha et al. 2015). In some cases the best-fit model is inconsistent with the upper flux density limits, which can be the result of invalid model assumptions (e.g. those in the radio regime; Sect. 3.1.1), or incorrectly assigned upper flux density limits (i.e. different from the 3σ limits; Sect. 3.1.2).
Current usage metrics show cumulative count of Article Views (full-text article views including HTML views, PDF and ePub downloads, according to the available data) and Abstracts Views on Vision4Press platform.
Data correspond to usage on the plateform after 2015. The current usage metrics is available 48-96 hours after online publication and is updated daily on week days.
Initial download of the metrics may take a while.