Fig. 4
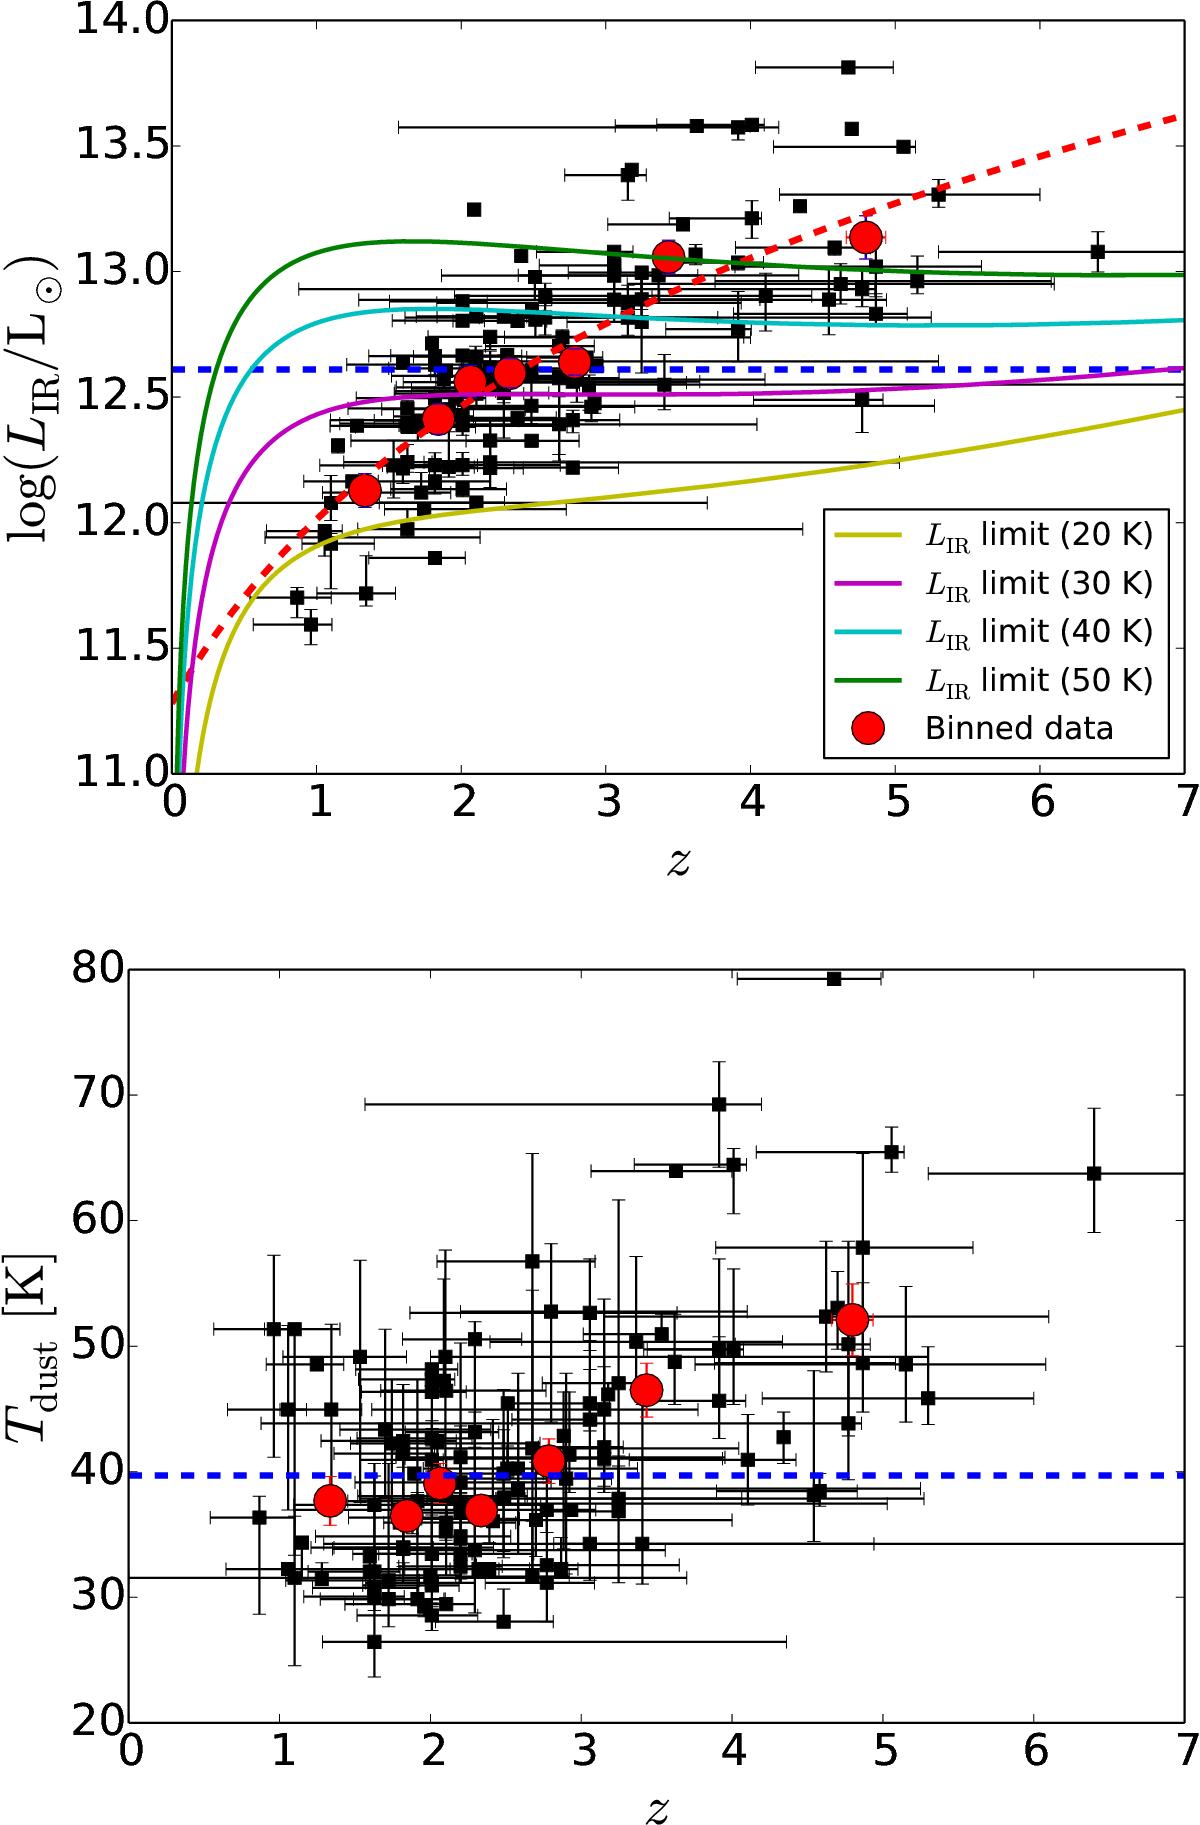
Infrared (8−1000μm) luminosity (top) and Tdust (bottom) as a function of redshift. In both panels, the horizontal blue dashed line shows the sample median (log (LIR/L⊙) = 12.61 and Tdust = 39.7 K). The red filled circles represent the mean values of the binned data (each bin contains 18 SMGs, except the highest redshift bin, which contains 16 SMGs), with the error bars showing the standard errors of the mean values (mostly smaller than the size of the data points in the top panel). The red dashed curve in the top panel indicates the best-fit function to the binned data, log (LIR/L⊙) ∝ (1 + z)0.09 ± 0.01. The solid lines show the lower IR luminosity limits calculated for the 4σ flux density limit of 5 mJy at the initial AzTEC selection wavelength of 1.1 mm. These LIR limits were computed assuming the local ULIRG template SEDs of Casey (2012), and are plotted at four different dust temperatures of 20 K (yellow), 30 K (magenta), 40 K (cyan), and 50 K (green).
Current usage metrics show cumulative count of Article Views (full-text article views including HTML views, PDF and ePub downloads, according to the available data) and Abstracts Views on Vision4Press platform.
Data correspond to usage on the plateform after 2015. The current usage metrics is available 48-96 hours after online publication and is updated daily on week days.
Initial download of the metrics may take a while.