Fig. 6
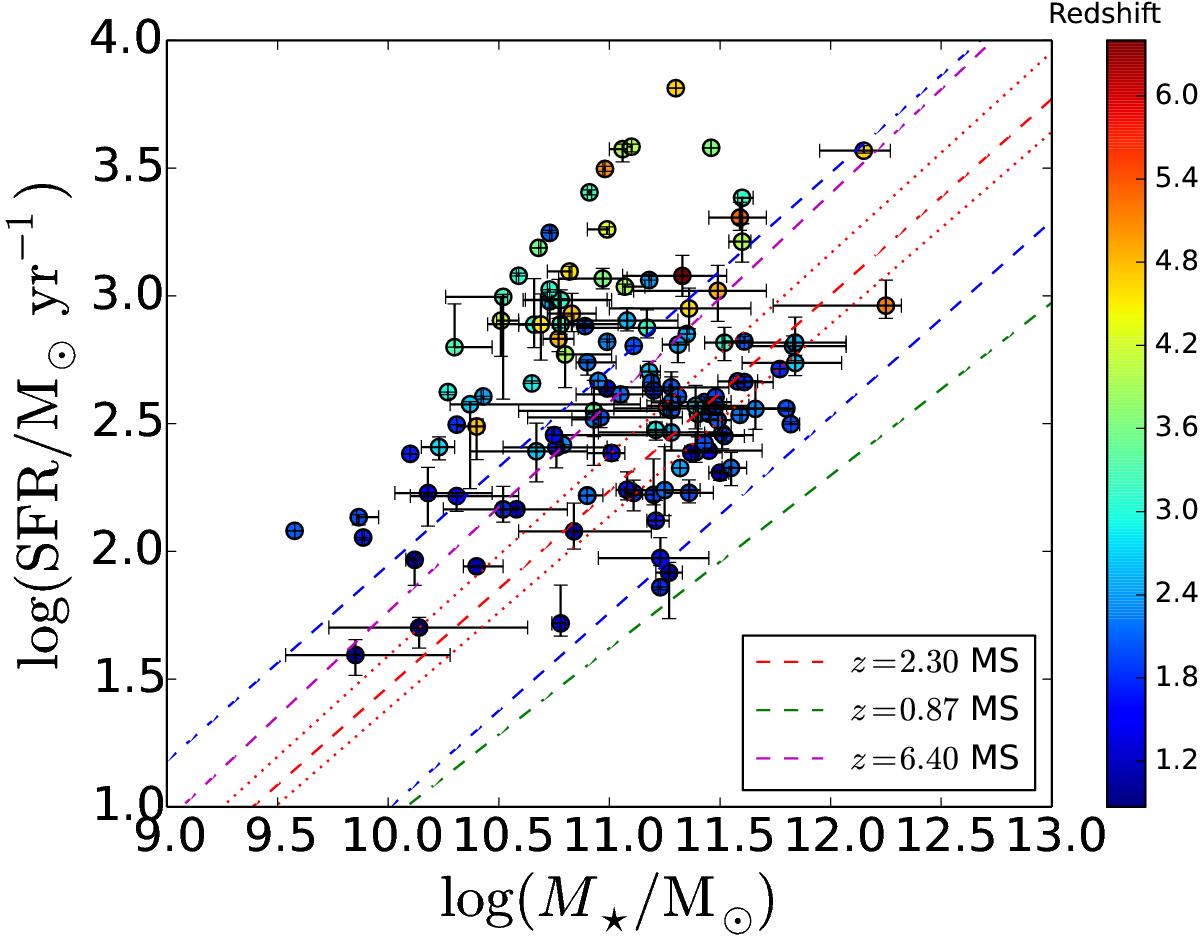
Main sequence diagram for our ALMA SMGs (a log-log plot of the SFR versus stellar mass). The data points are colour-coded with redshift as shown in the colourbar on the right. The red dashed line shows the mid-line position of the star-forming MS at the median redshift of the analysed SMGs (z = 2.30) as given by Speagle et al. (2014), with the lower and upper blue dashed lines indicating a factor of three offset below and above the MS. The red, dotted lines indicate the MS mid-line boundaries of the interquartile redshift range of IQR(z) = 3.15−1.91 = 1.24. For comparison, the green and magenta dashed lines show the MS mid-lines at the lowest and highest redshifts of the analysed sources (z = 0.87 and z = 6.40), respectively.
Current usage metrics show cumulative count of Article Views (full-text article views including HTML views, PDF and ePub downloads, according to the available data) and Abstracts Views on Vision4Press platform.
Data correspond to usage on the plateform after 2015. The current usage metrics is available 48-96 hours after online publication and is updated daily on week days.
Initial download of the metrics may take a while.