Fig. 8
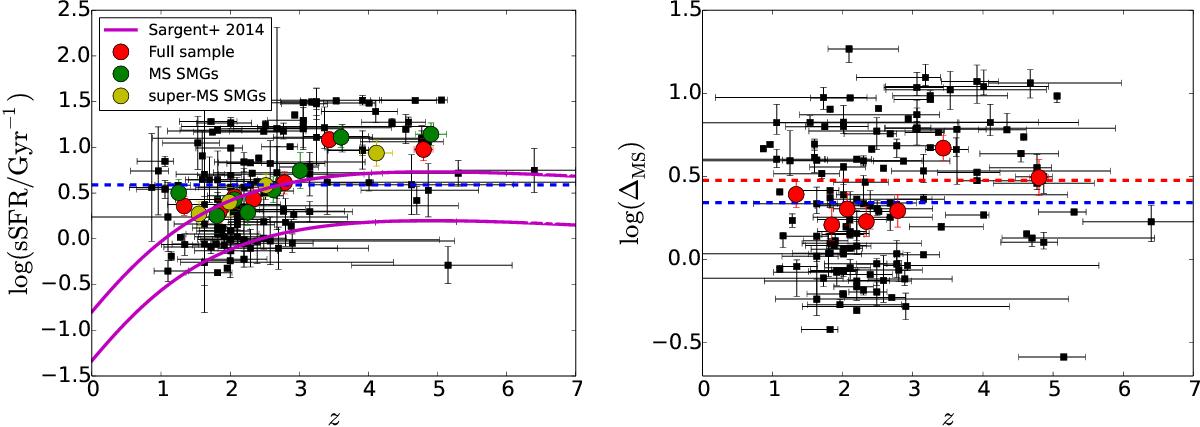
Specific SFR (sSFR; left panel) and starburstiness (right panel) as a function of redshift. In both panels, the red filled circles represent the mean values of the binned data for the full sample as in Fig. 4. In the left panel, the green and yellow filled circles represent the mean values of the binned data for the MS SMGs and starburst SMGs, respectively. For the MS sample, each bin contains nine sources, except the highest redshift bin, which contains eight SMGs. For the starburst sample, each bin contains 13 sources. The blue horizontal dashed lines mark the sample median values of sSFR = 3.9 Gyr-1 and ΔMS = 2.2. The magenta curves in the left panel represent the sSFR(M⋆,z) relationship of Sargent et al. (2014; Eq. (A1) therein), which is here plotted for our minimum and maximum stellar mass values (upper and lower curves, respectively). In the right panel, the red dashed line shows the upper boundary of the MS at ΔMS = 3.
Current usage metrics show cumulative count of Article Views (full-text article views including HTML views, PDF and ePub downloads, according to the available data) and Abstracts Views on Vision4Press platform.
Data correspond to usage on the plateform after 2015. The current usage metrics is available 48-96 hours after online publication and is updated daily on week days.
Initial download of the metrics may take a while.