Fig. 9
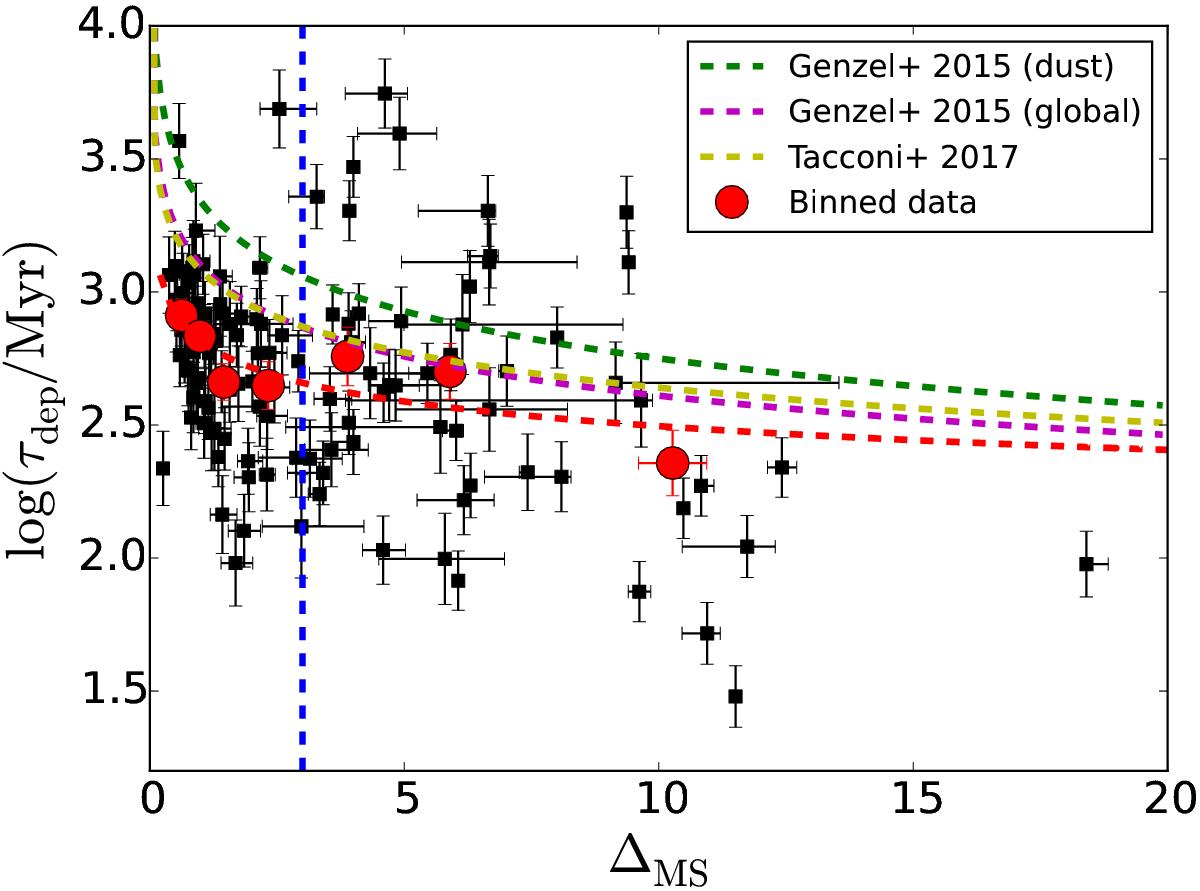
Gas depletion timescale as a function of ΔMS = SFR/SFRMS. The red filled circles represent the mean values of the binned data as in Fig. 4. A MS border of ΔMS = 3 is indicated by a vertical, blue dashed line. The red, dashed curve indicates the best-fit function to the binned data, ![]() . The green and magenta dashed curves show the relationships derived by Genzel et al. (2015) for the dust-based and CO plus dust-based (global) τdep values, respectively. The yellow dashed line shows the best-fit relation from Tacconi et al. (2017), which almost overlaps with the global Genzel et al. (2015) relation.
. The green and magenta dashed curves show the relationships derived by Genzel et al. (2015) for the dust-based and CO plus dust-based (global) τdep values, respectively. The yellow dashed line shows the best-fit relation from Tacconi et al. (2017), which almost overlaps with the global Genzel et al. (2015) relation.
Current usage metrics show cumulative count of Article Views (full-text article views including HTML views, PDF and ePub downloads, according to the available data) and Abstracts Views on Vision4Press platform.
Data correspond to usage on the plateform after 2015. The current usage metrics is available 48-96 hours after online publication and is updated daily on week days.
Initial download of the metrics may take a while.