Fig. 9
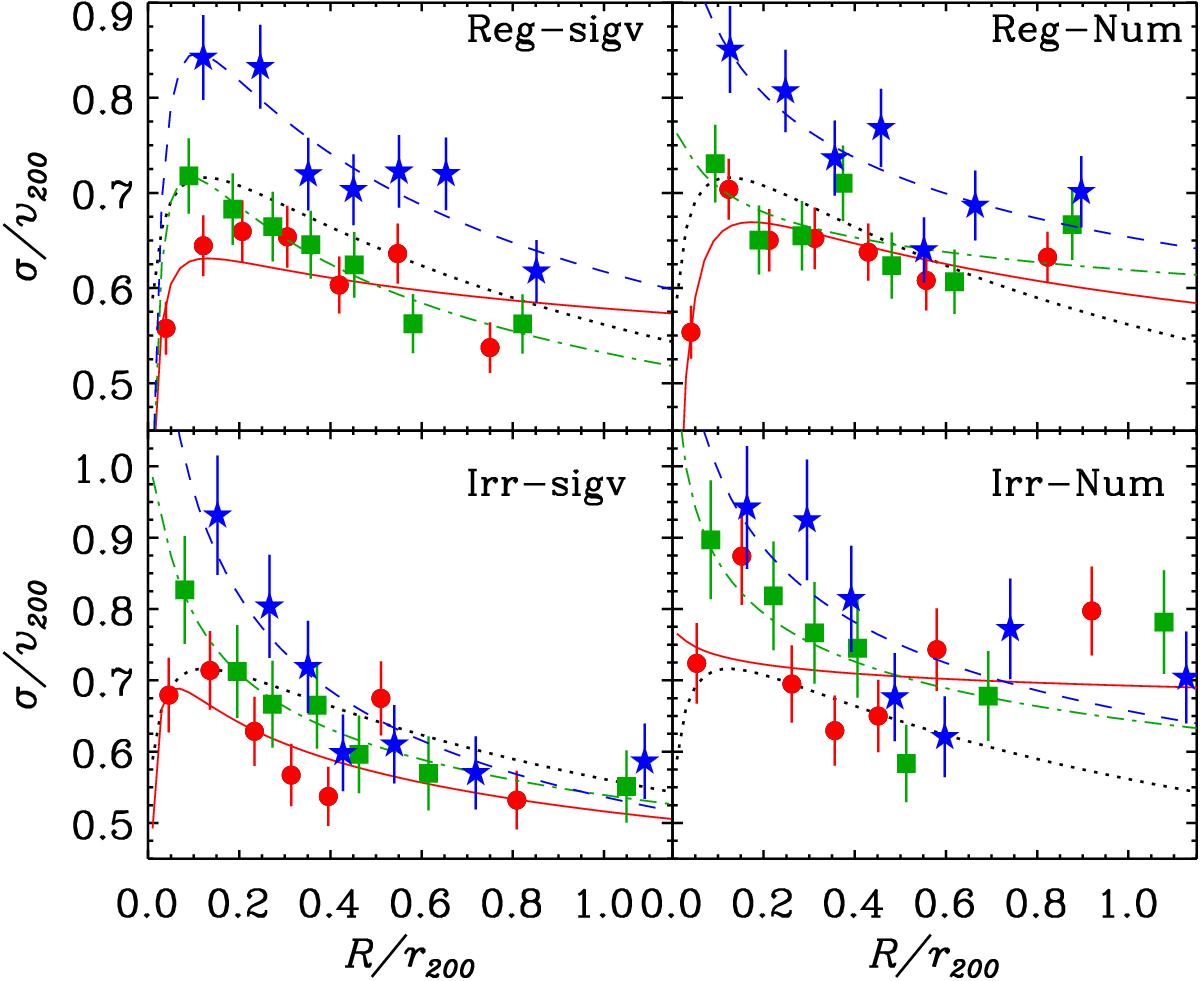
Line-of-sight velocity dispersion profiles of different cluster galaxy populations in the four stack samples (top-left: Reg-sigv; top-right: Reg-Num; bottom-left: Irr-sigv; bottom-right: Irr-Num). Red dots, green squares, and blue stars represent the VDPs of E, S0, and S galaxies, respectively. The red solid, green dash-dotted, and blue dashed lines represent model fits described by Eq. (2) and Table 3. The black dotted line represents the theoretical VDP predicted for a cluster with a NFW mass distribution of concentration c ≡ r200/rs = 3 and with a velocity anisotropy profile for its galaxies given by Eq. (60) in Mamon & Łokas (2005) with ra = rs. Error bars are computed according to Eq. (16) of Beers et al. (1990).
Current usage metrics show cumulative count of Article Views (full-text article views including HTML views, PDF and ePub downloads, according to the available data) and Abstracts Views on Vision4Press platform.
Data correspond to usage on the plateform after 2015. The current usage metrics is available 48-96 hours after online publication and is updated daily on week days.
Initial download of the metrics may take a while.