Free Access
Fig. 10
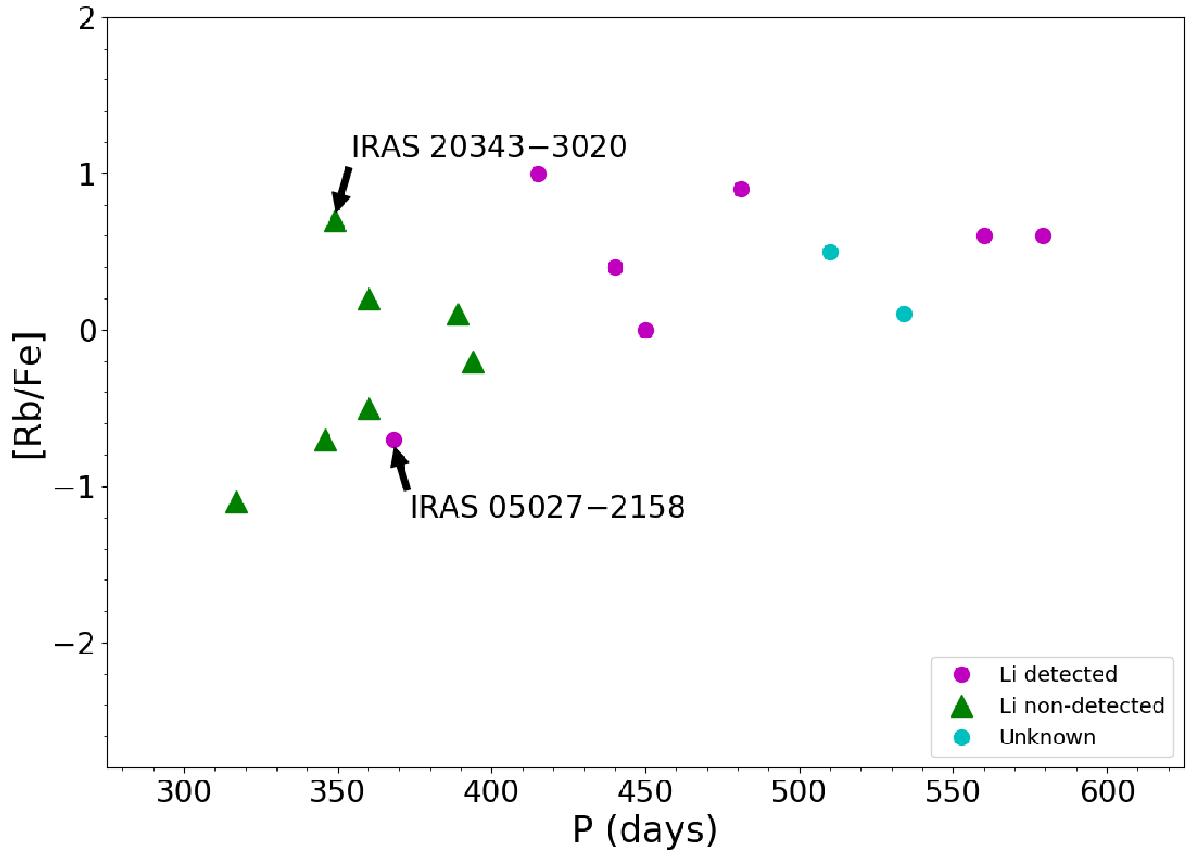
[Rb/Fe] pseudo-dynamical abundances versus variability period (P). The Li-rich and Li-poor stars are marked with magenta dots and green triangles, respectively. The two stars where Li could not be estimated are marked with cyan dots (see text).
Current usage metrics show cumulative count of Article Views (full-text article views including HTML views, PDF and ePub downloads, according to the available data) and Abstracts Views on Vision4Press platform.
Data correspond to usage on the plateform after 2015. The current usage metrics is available 48-96 hours after online publication and is updated daily on week days.
Initial download of the metrics may take a while.