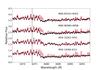
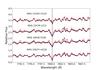
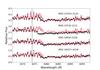
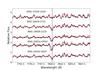
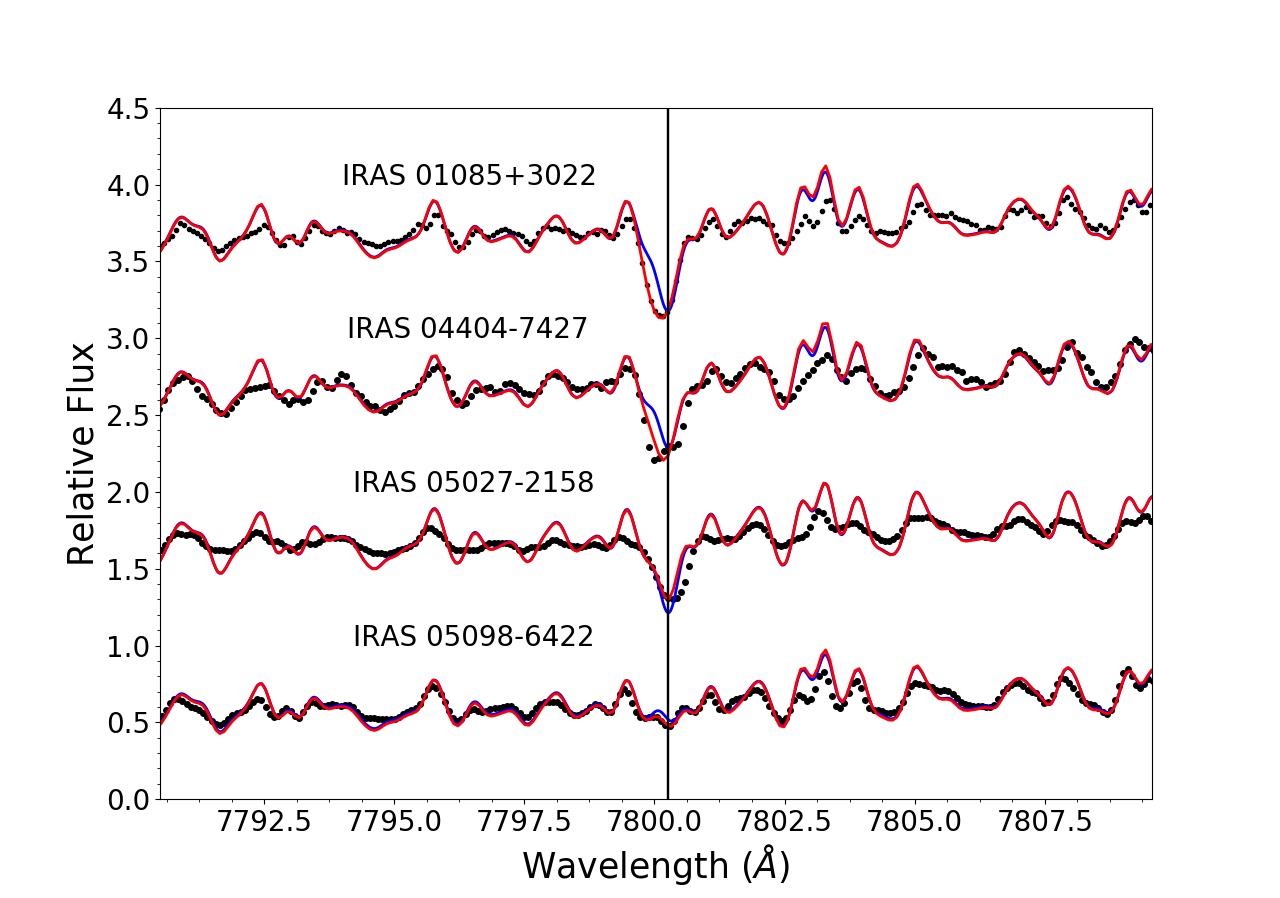
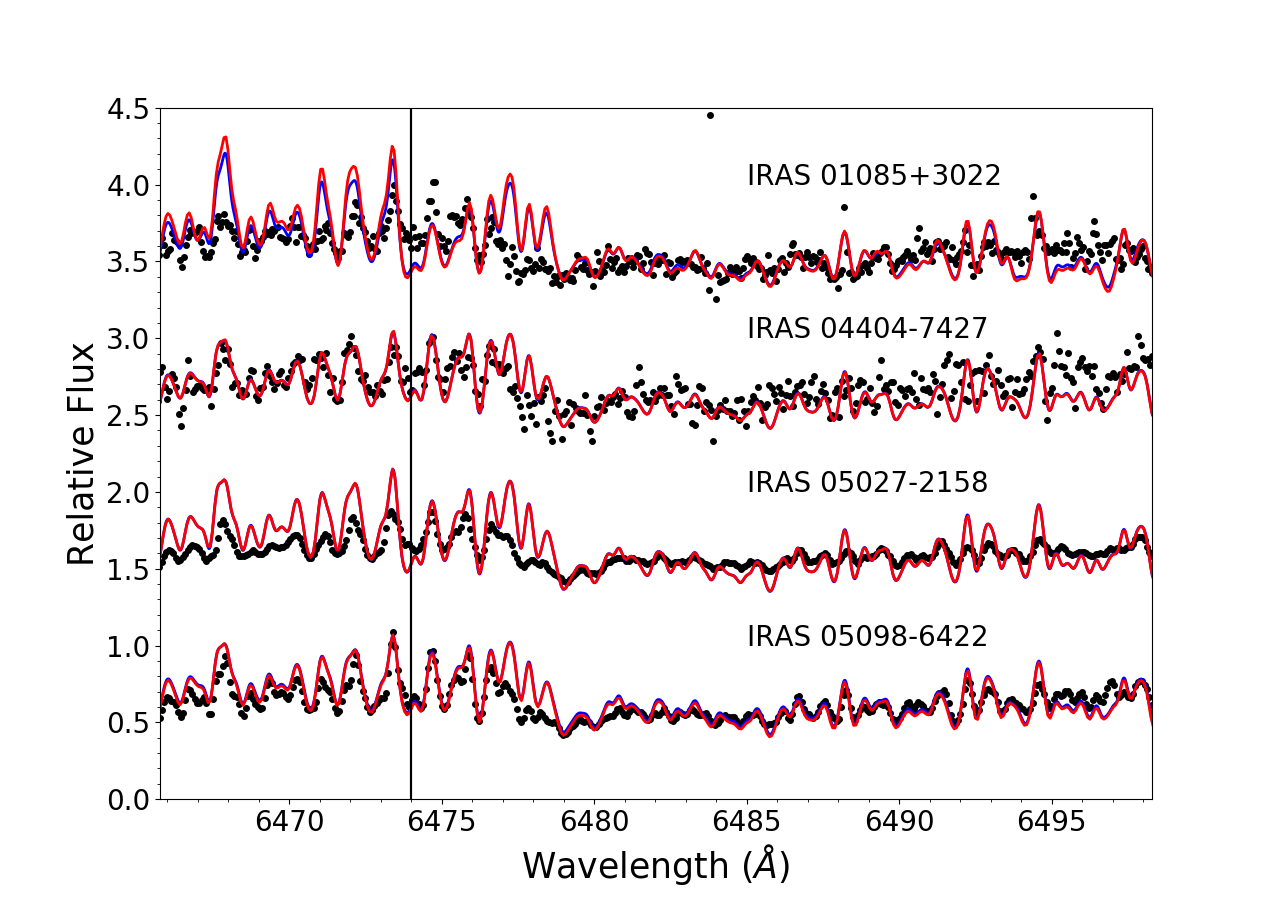
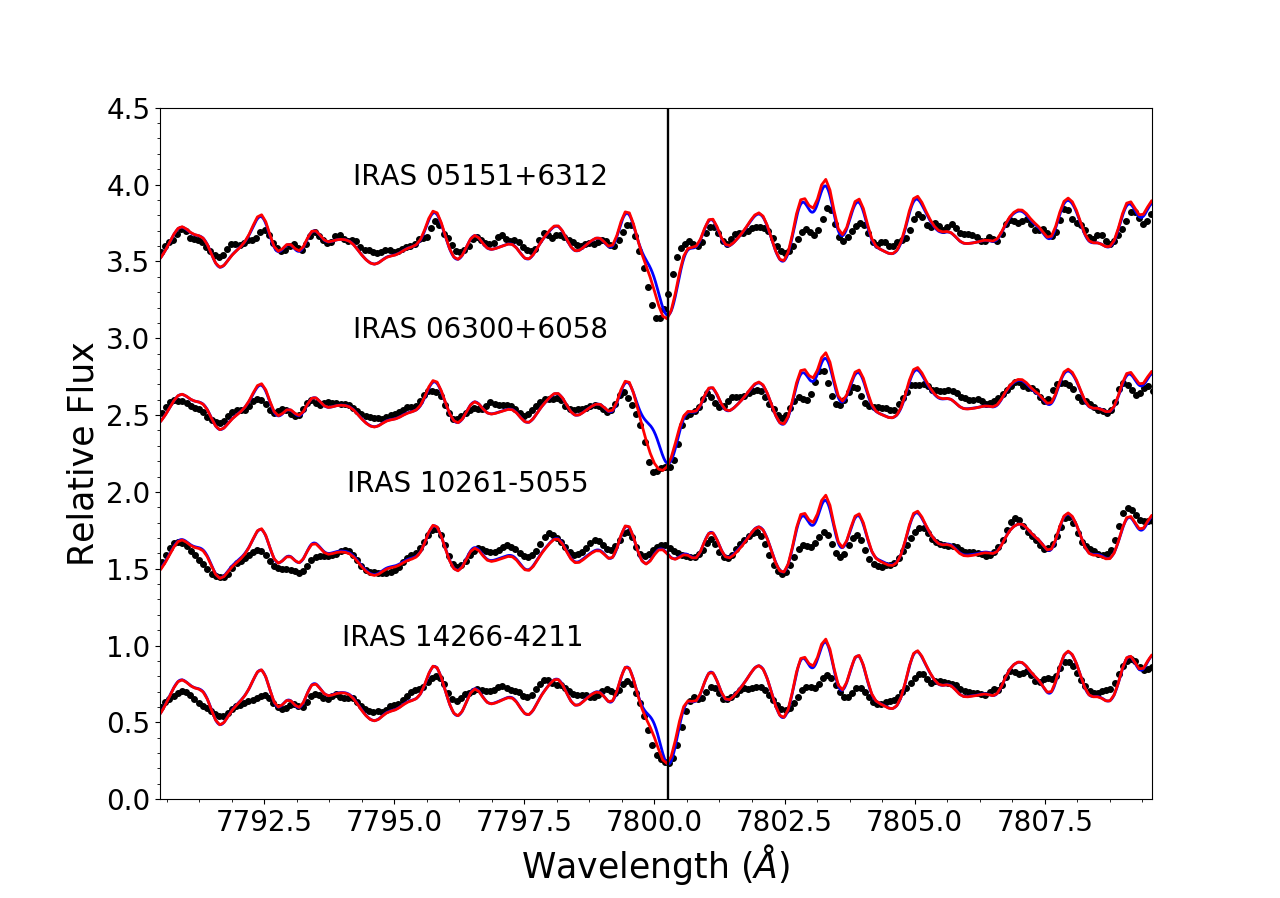
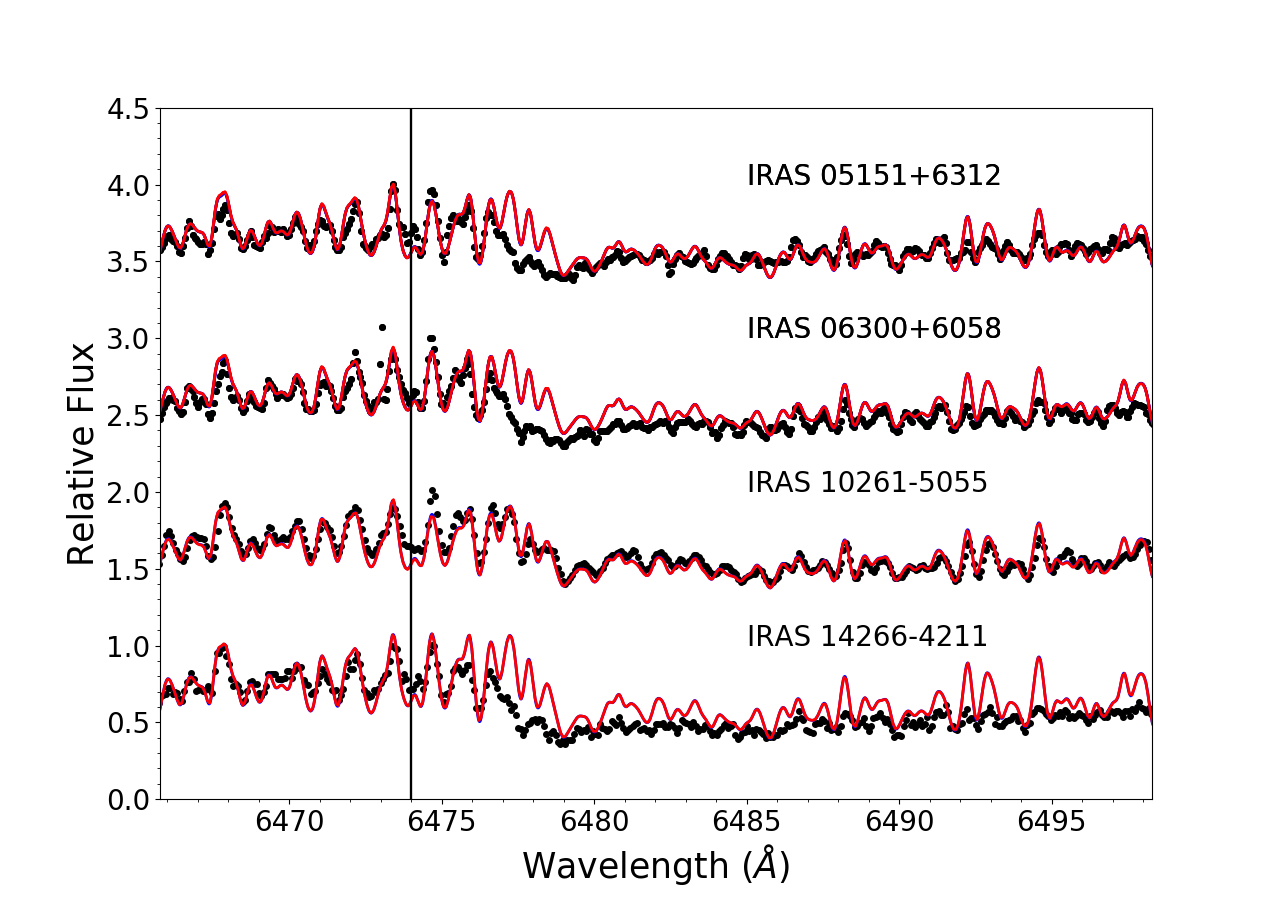
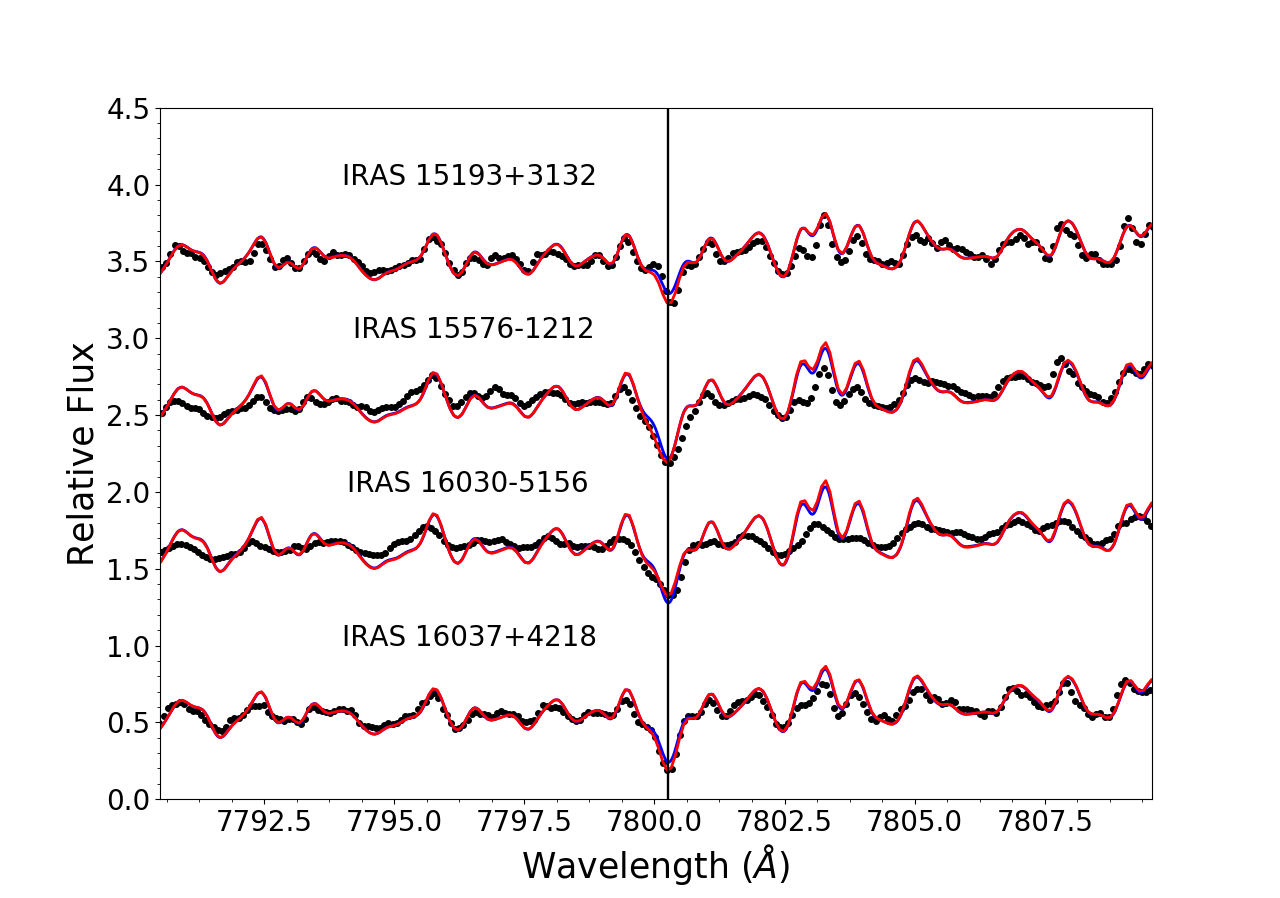
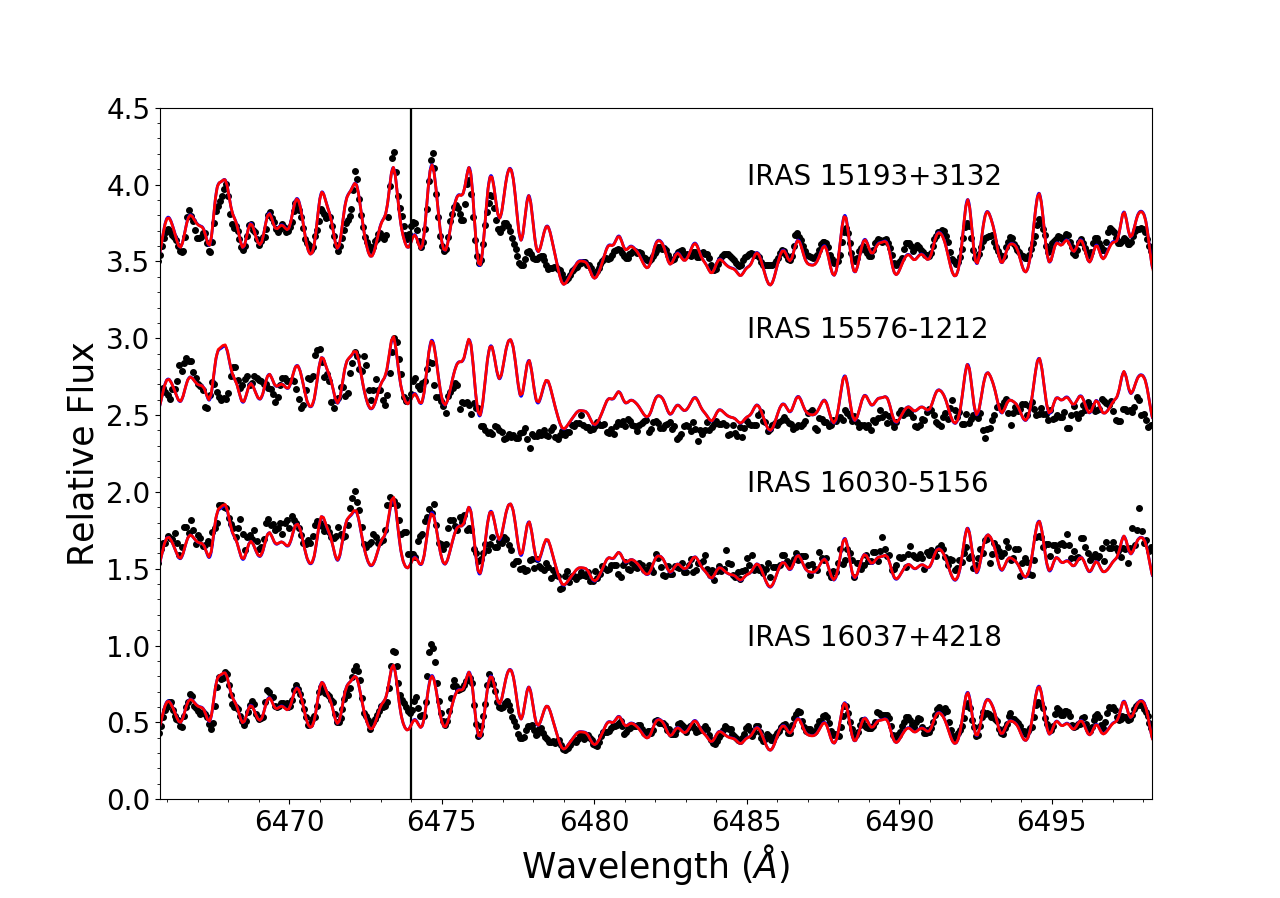
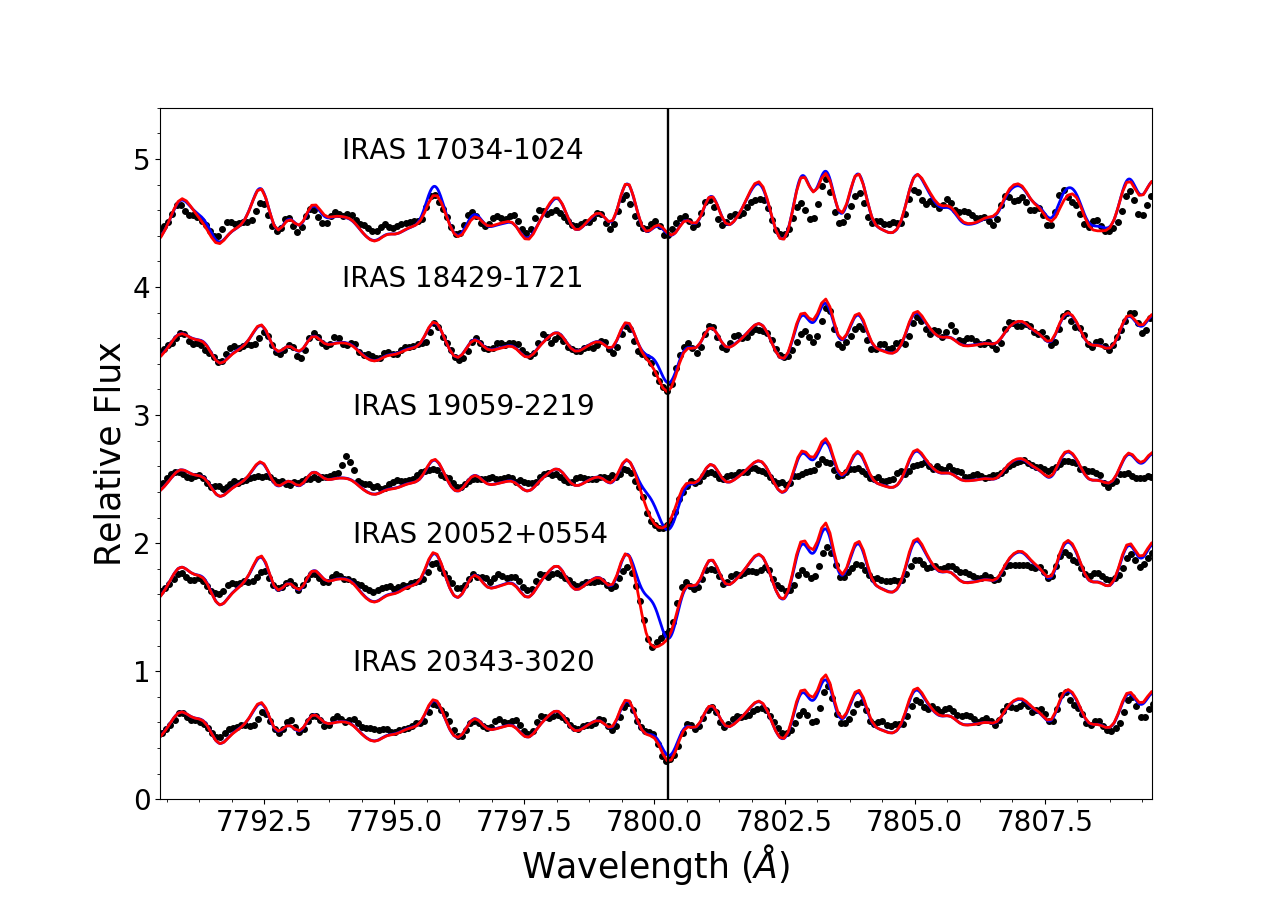
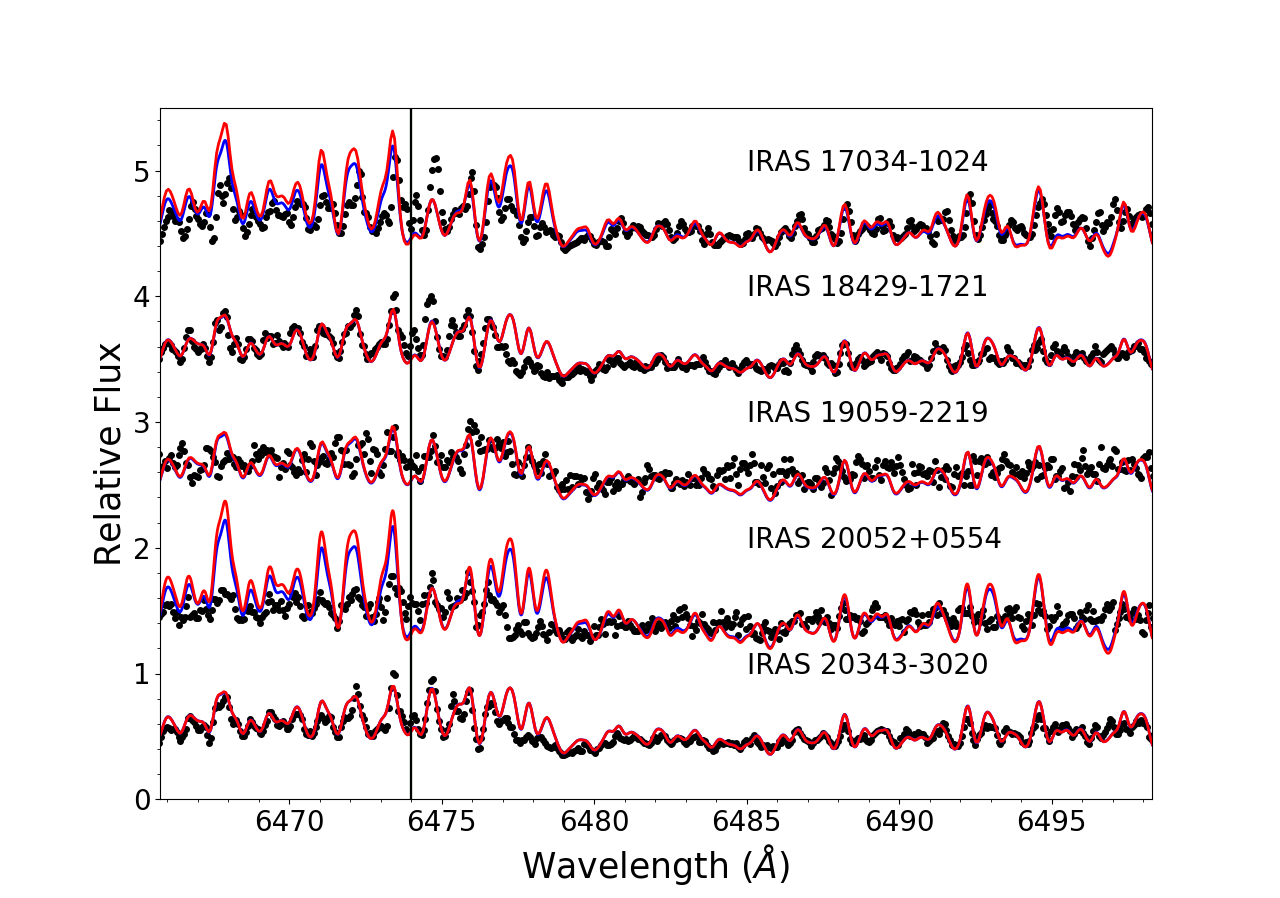
Fig. A.1
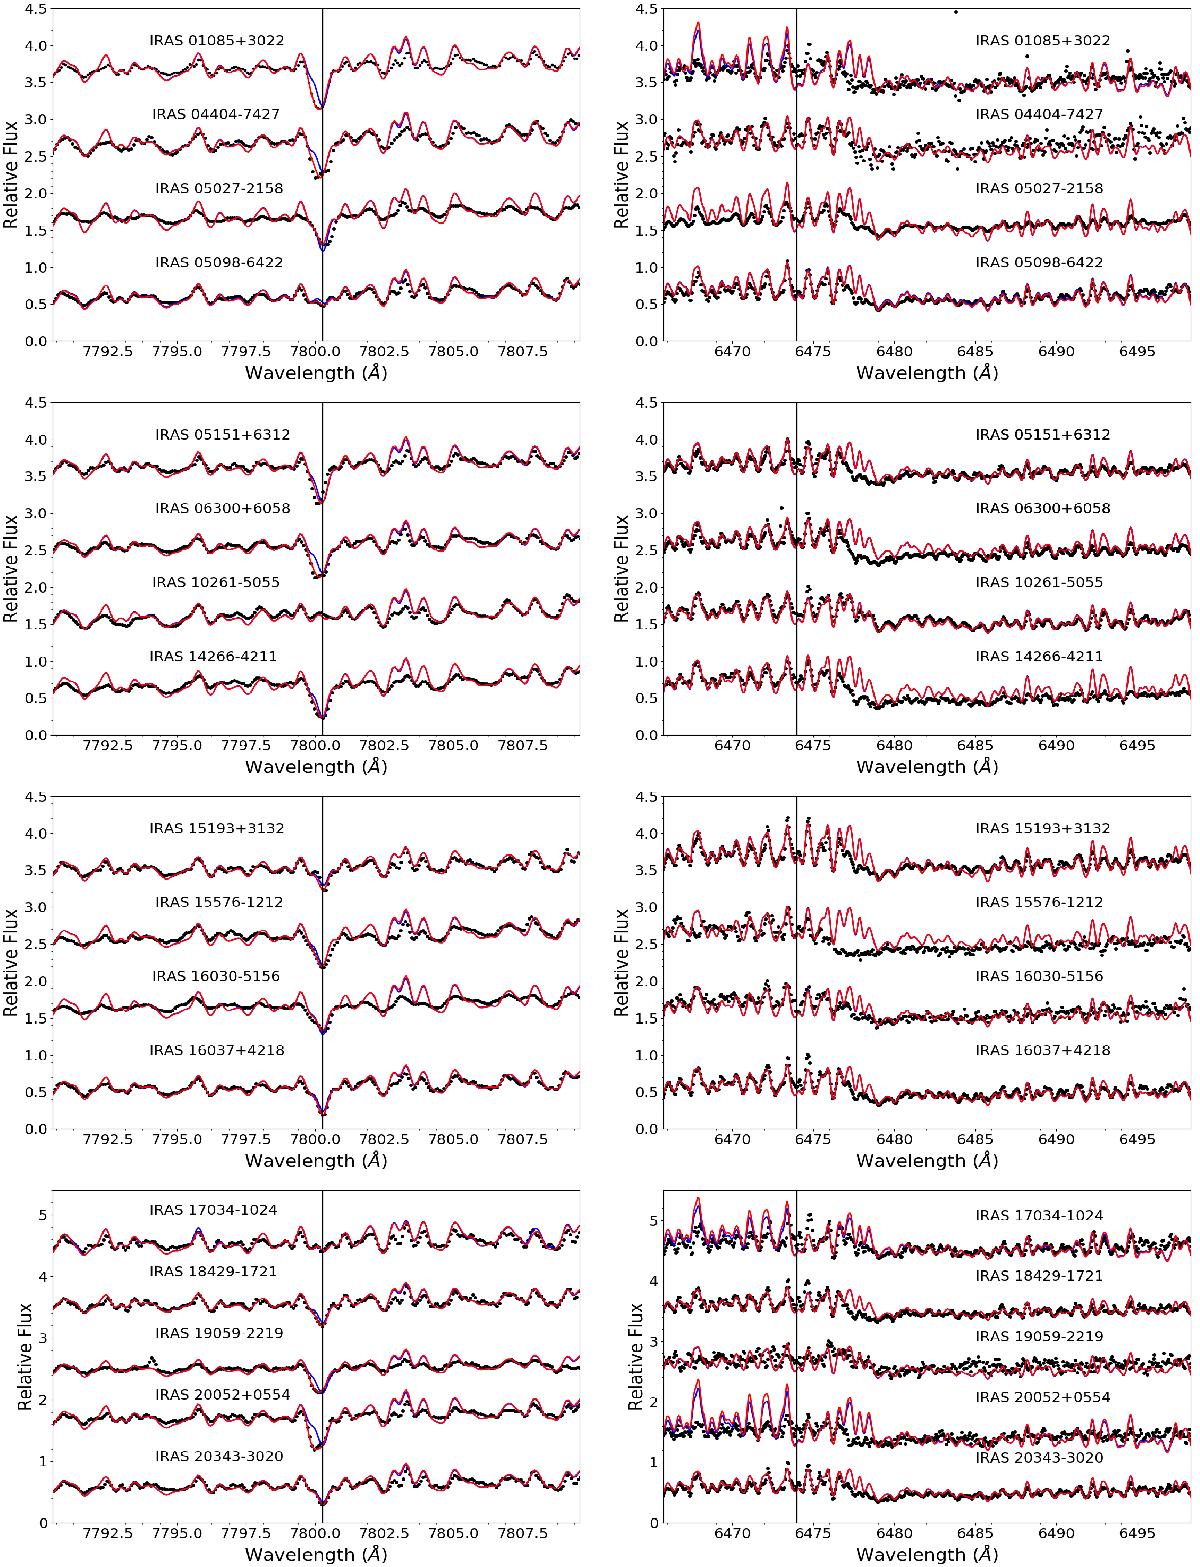
Observed spectra (black dots), best hydrostatic (blue lines) and pseudo-dynamical (red lines) fits of our sample of AGB stars in the regions of 7800 Å Rb I line (left panels) and 6474 Å ZrO bandhead (right panels). The parameters of the best fit model atmospheres are indicated in Table 3. The plots are displayed in increasing R.A. order.
Current usage metrics show cumulative count of Article Views (full-text article views including HTML views, PDF and ePub downloads, according to the available data) and Abstracts Views on Vision4Press platform.
Data correspond to usage on the plateform after 2015. The current usage metrics is available 48-96 hours after online publication and is updated daily on week days.
Initial download of the metrics may take a while.