Free Access
Fig. 6
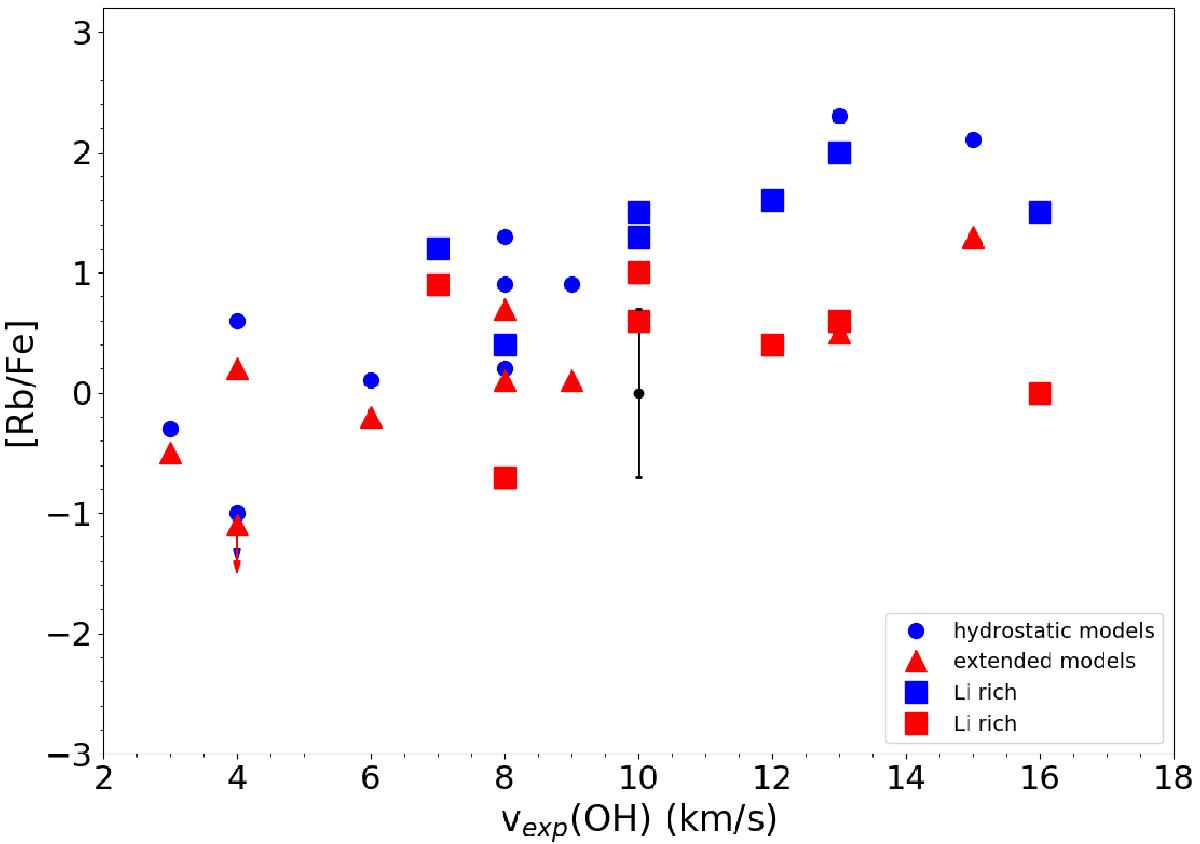
Rb abundances derived both with hydrostatic (blue dots) and pseudo-dynamical model atmospheres (red triangles) with best-fit parameters plotted against the OH expansion velocity. The Li-rich stars are indicated by squares. A typical error bar of ±0.7 dex is also displayed.
Current usage metrics show cumulative count of Article Views (full-text article views including HTML views, PDF and ePub downloads, according to the available data) and Abstracts Views on Vision4Press platform.
Data correspond to usage on the plateform after 2015. The current usage metrics is available 48-96 hours after online publication and is updated daily on week days.
Initial download of the metrics may take a while.