Free Access
Fig. 5
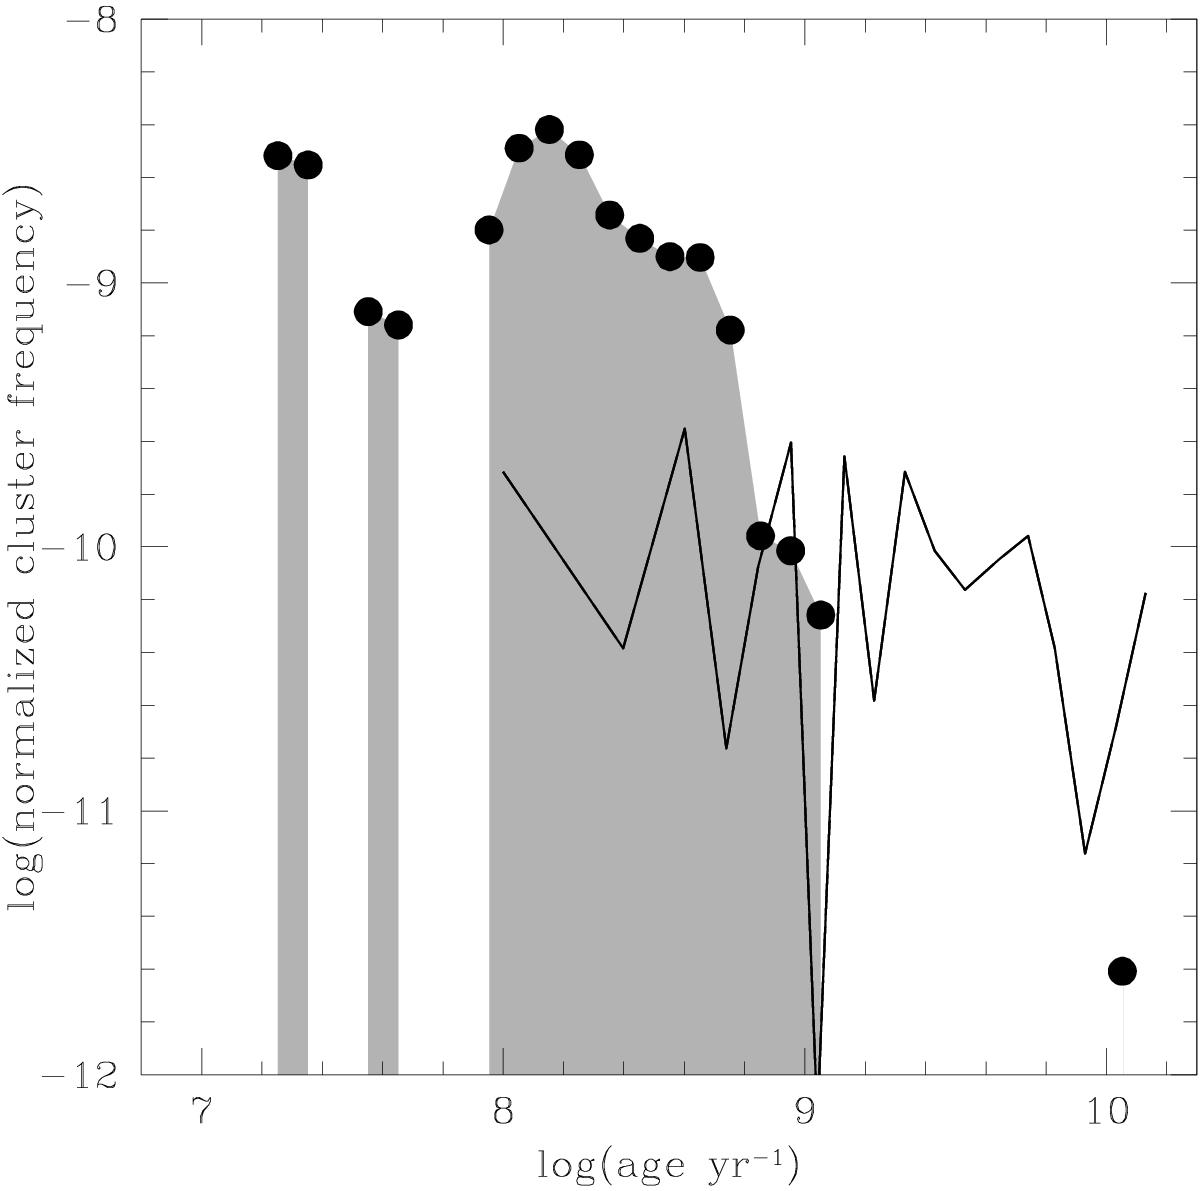
CF of the surveyed region in the LMC bar (filled circles). The grey areas highlight the periods of star cluster formation activity, while the solid line represents the CF recovered from the corresponding SFR obtained by Smecker-Hane et al. (2002).
Current usage metrics show cumulative count of Article Views (full-text article views including HTML views, PDF and ePub downloads, according to the available data) and Abstracts Views on Vision4Press platform.
Data correspond to usage on the plateform after 2015. The current usage metrics is available 48-96 hours after online publication and is updated daily on week days.
Initial download of the metrics may take a while.