Free Access
Fig. B.1
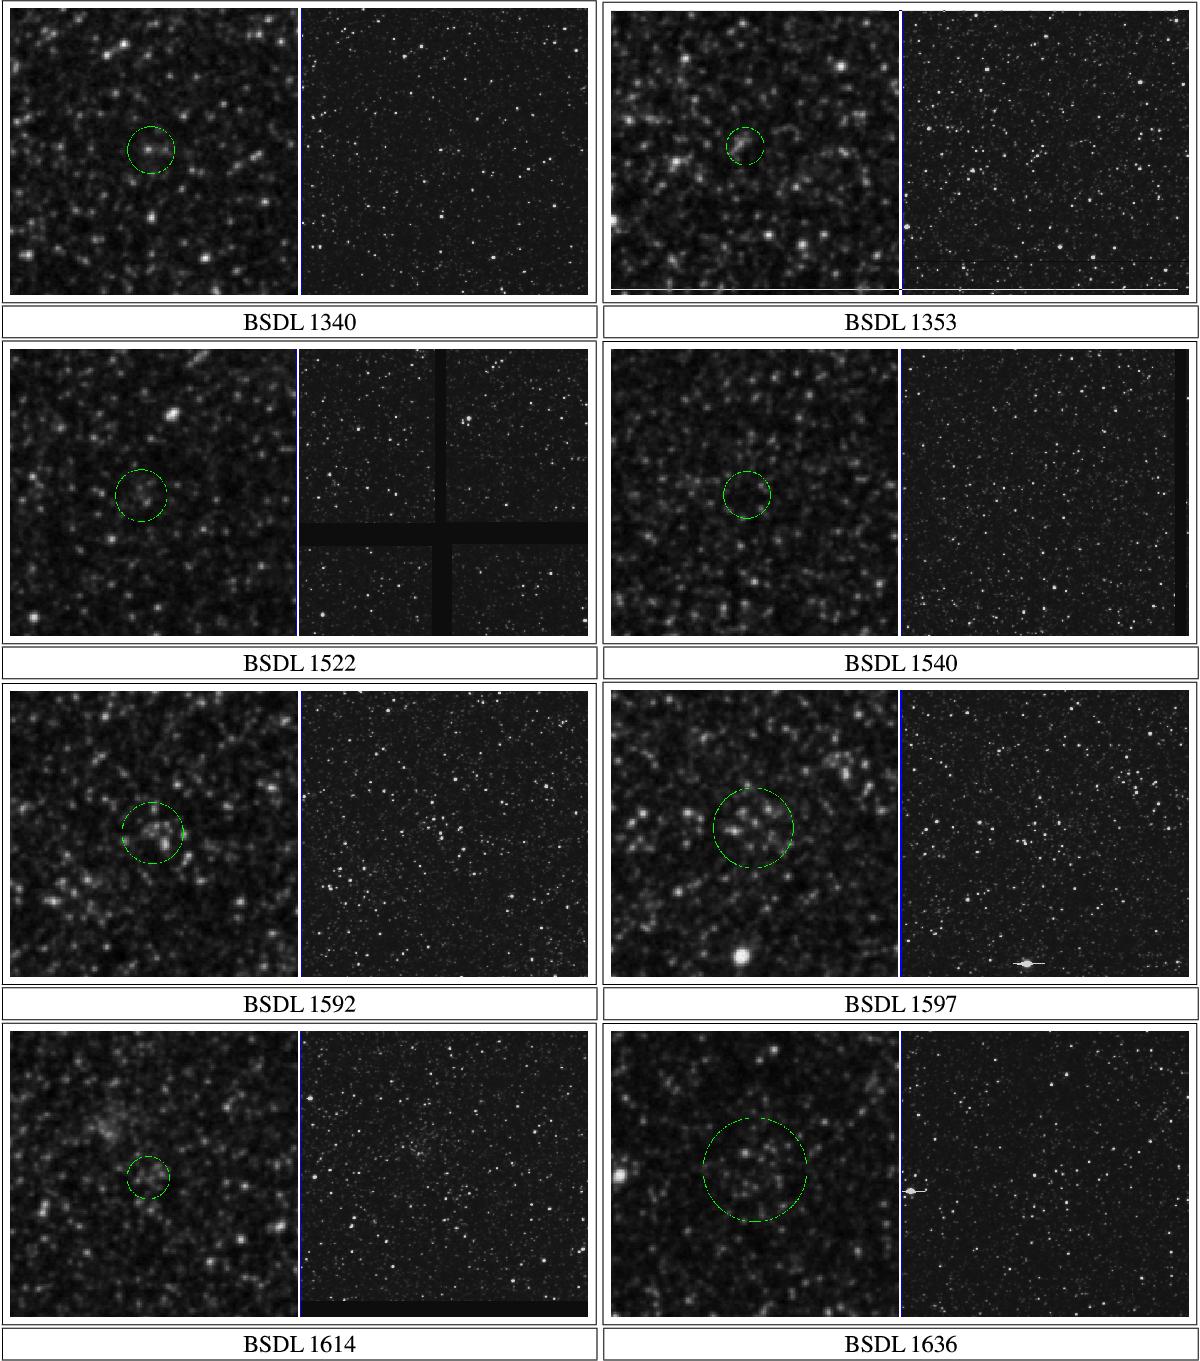
3×3 arcmin2 DSS Red (left) and R (right) images centred on objects catalogued by B08 (see text for details). North is up and East to the left. The green circle illustrates the angular dimension given in B08.
Current usage metrics show cumulative count of Article Views (full-text article views including HTML views, PDF and ePub downloads, according to the available data) and Abstracts Views on Vision4Press platform.
Data correspond to usage on the plateform after 2015. The current usage metrics is available 48-96 hours after online publication and is updated daily on week days.
Initial download of the metrics may take a while.