Fig. 15
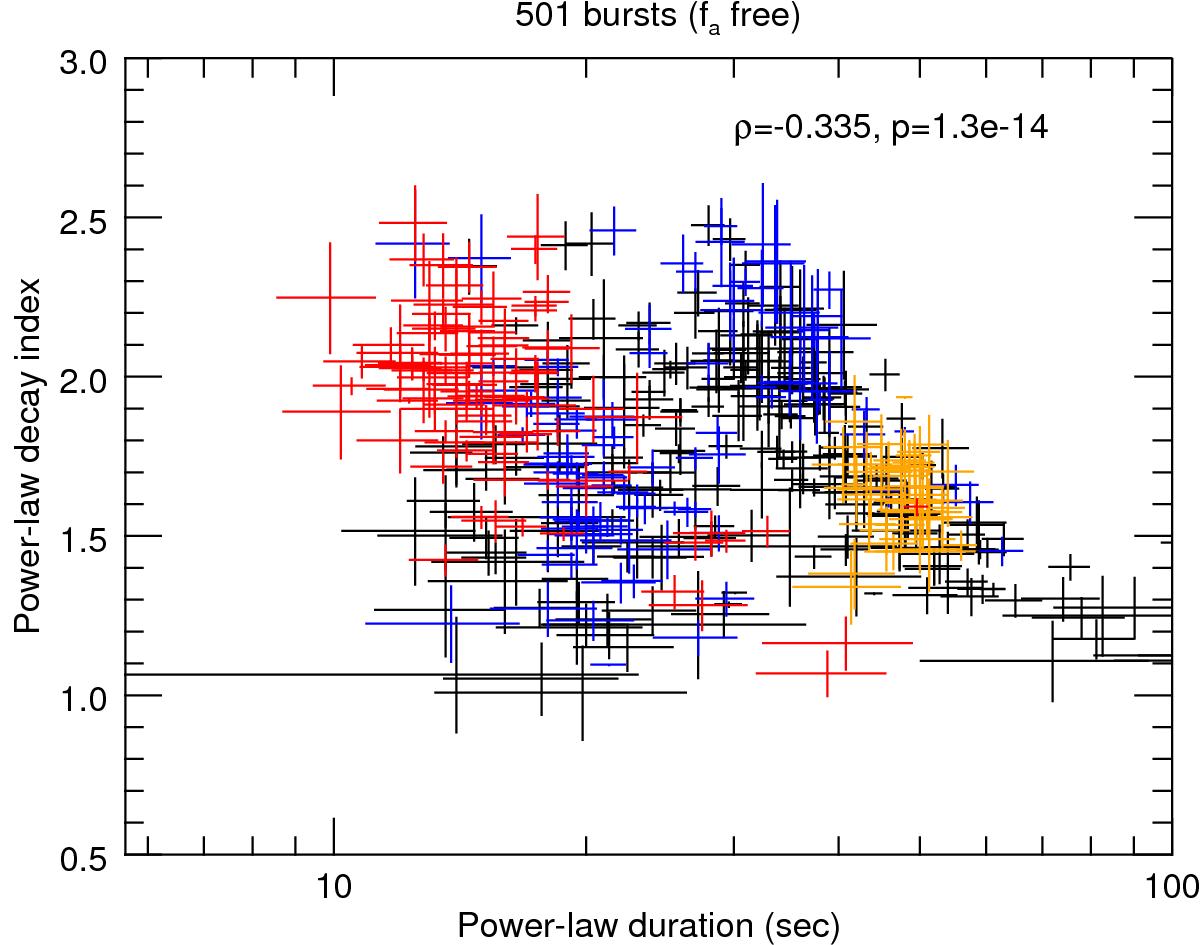
Diagram of α against the duration when the power-law flux is above 5% of the peak flux. The red data points refer to bursts from (hydrogen-deficient and, thus, rp-process deficient) UCXBs 4U 0513-40, 2S 0918-549, 4U 1728-34, 4U 1820-30, XB 1916-053, and 4U 2129+12. The blue data points refer to 4U 1636-536 and the orange points to GS 1826-24. This diagram shows the strongest trend in our data with two branches: the short (left) and long branch (right).
Current usage metrics show cumulative count of Article Views (full-text article views including HTML views, PDF and ePub downloads, according to the available data) and Abstracts Views on Vision4Press platform.
Data correspond to usage on the plateform after 2015. The current usage metrics is available 48-96 hours after online publication and is updated daily on week days.
Initial download of the metrics may take a while.