Fig. 3
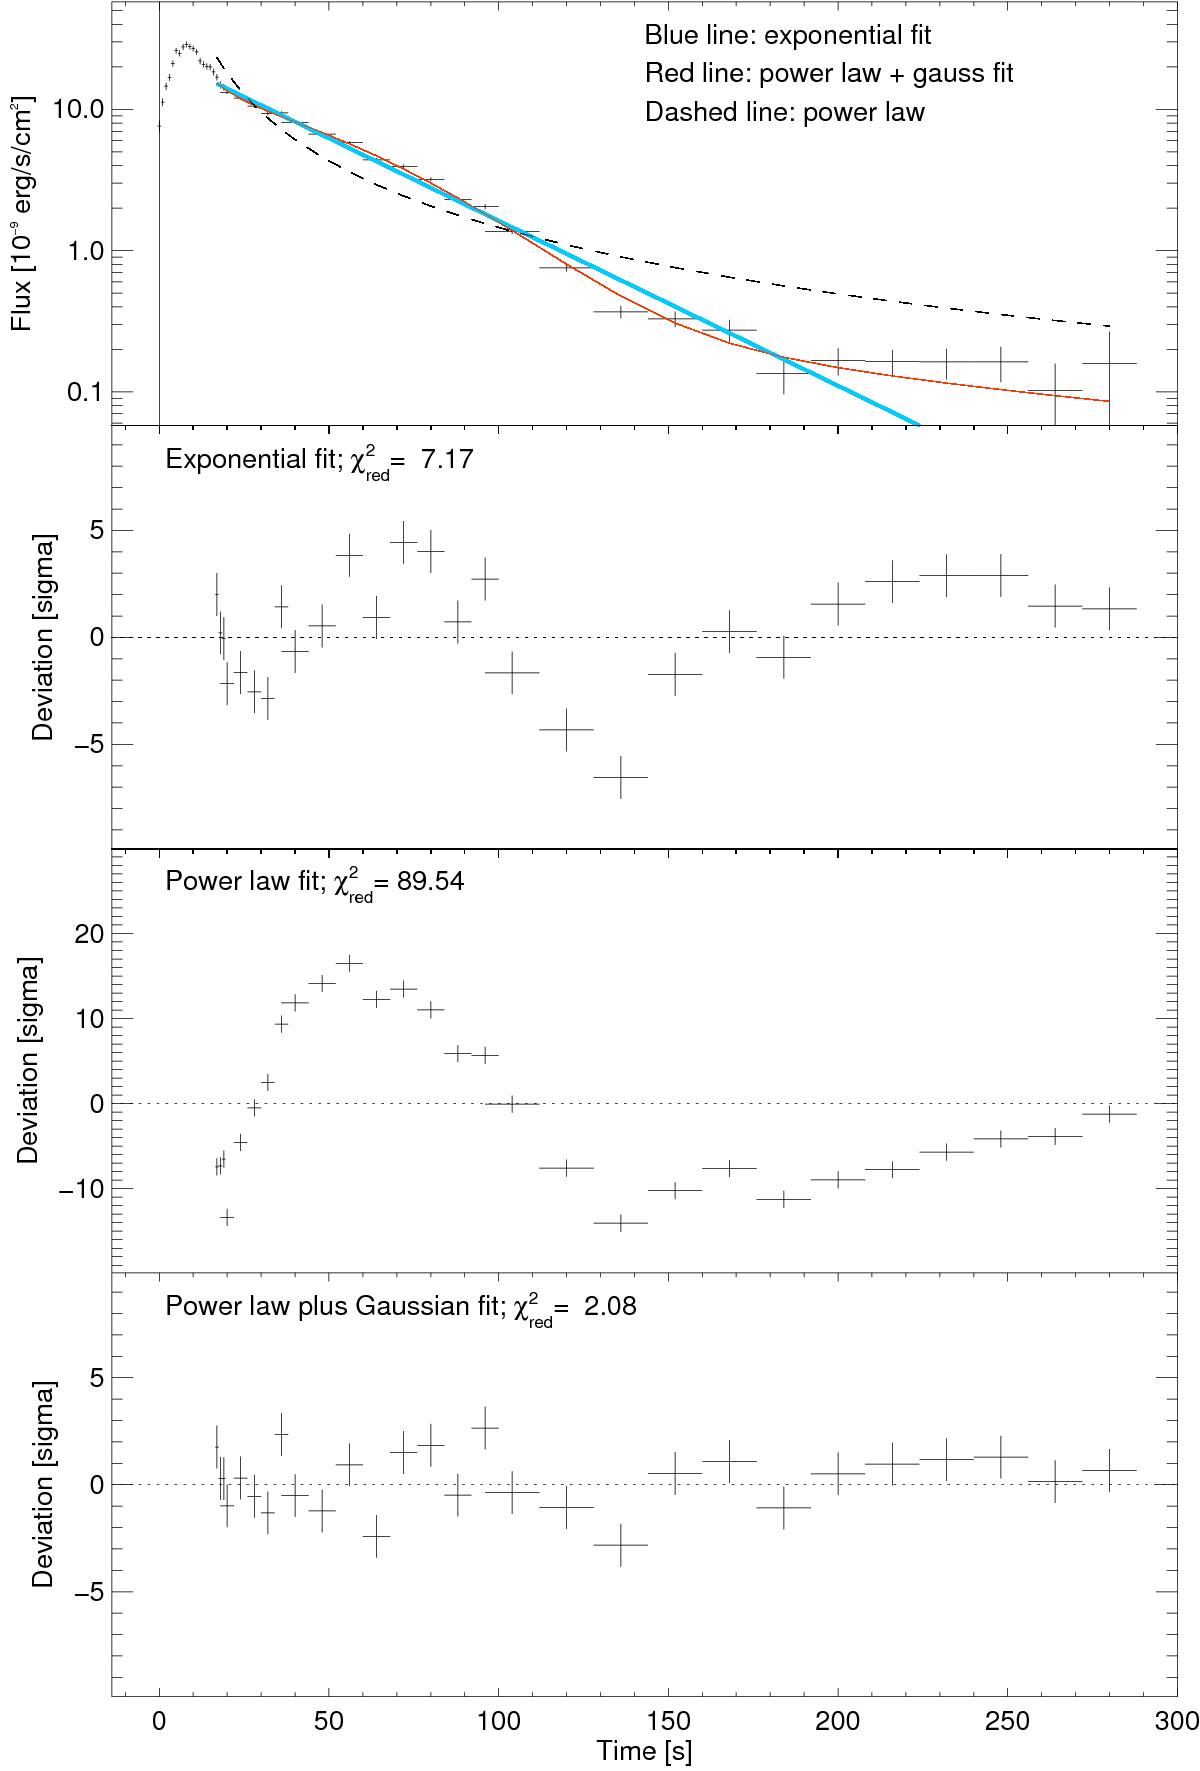
Example of a fit to the decay phase of a bolometric light curve of a burst. This is the same burst as in Fig. 2. The top panel shows in logarithmic scale the bolometric flux and the best-fit models for an exponential decay (dashed curve; Eq. (1)), the power law (blue curve; Eq. (2)), and the power-law plus Gaussian function (red curve; Eq. (3)). The second, third, and fourth panels show the residuals with respect to models following Eqs. (1)–(3). The power-law plus Gaussian function is the best model.
Current usage metrics show cumulative count of Article Views (full-text article views including HTML views, PDF and ePub downloads, according to the available data) and Abstracts Views on Vision4Press platform.
Data correspond to usage on the plateform after 2015. The current usage metrics is available 48-96 hours after online publication and is updated daily on week days.
Initial download of the metrics may take a while.