Free Access
Fig. 7
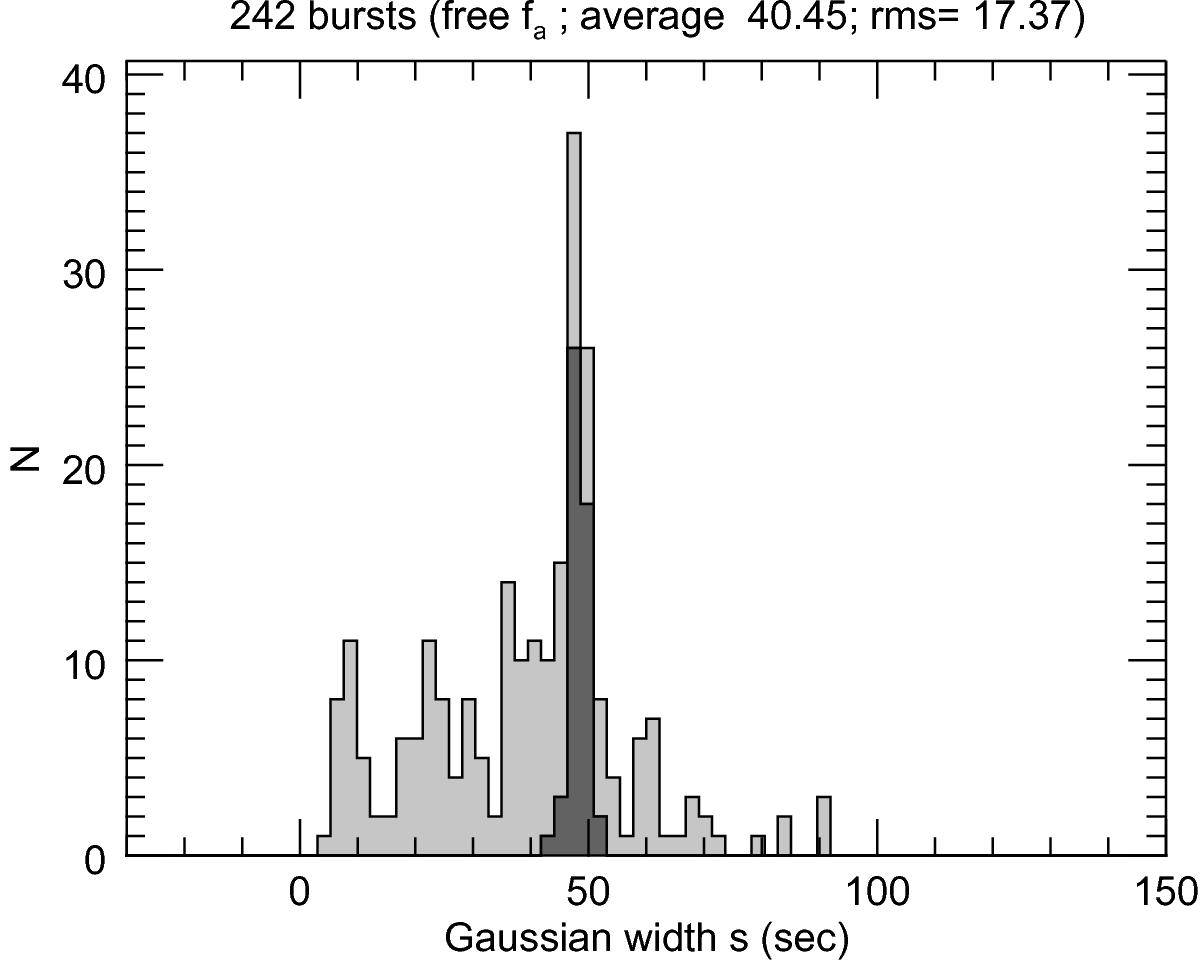
Histogram of Gaussian width s, as found from fitting with Eq. (3). The peak at 48 s is due to bursts from GS 1826-24, as indicated by the dark gray shaded part of the histogram. Note the cutoff at 60−70 s.
Current usage metrics show cumulative count of Article Views (full-text article views including HTML views, PDF and ePub downloads, according to the available data) and Abstracts Views on Vision4Press platform.
Data correspond to usage on the plateform after 2015. The current usage metrics is available 48-96 hours after online publication and is updated daily on week days.
Initial download of the metrics may take a while.