Fig. 10

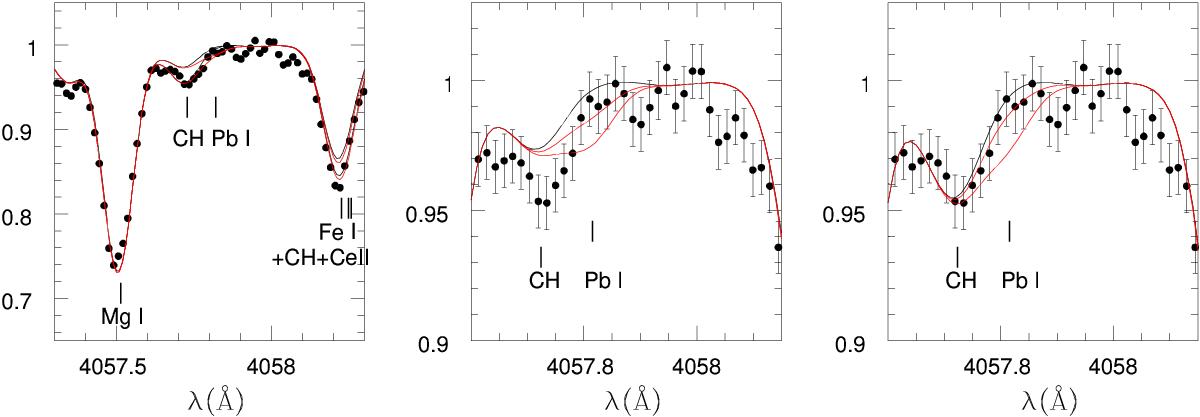
Observed (dots with error bars) and synthetic spectra (lines) around the Pb line at 4057.8 Å. This Pb line lies in the red wing of a weak 12CH feature (from the B-X system), which proved to be underestimated with the carbon abundance derived from the G-band (12CH A-X system), as shown in the middle panel. Two hypotheses for the abundances of carbon have therefore been considered here: (1) the nominal abundance log ϵ(C) = 5.94 (middle panel); and (2) an abundance log ϵ(C) = 6.20, which best fits the CH 4057.7 Å line (right panel). The left panel shows together the best-fit values for Pb (red curves) and the synthesis with no Pb (black curves) in these two cases. Middle panel: syntheses are shown for log ϵ(Pb) = −0.15 and + 0.25 (respectively, the best-fit and a conservative upper limit, shown in red), and no Pb, assuming the nominal C abundance. Right panel: log ϵ(Pb) = −0.25 and + 0.25 (respectively, the best-fit and a conservative upper limit, shown in red), and no Pb, assuming log ϵ(C) = 6.20.
Current usage metrics show cumulative count of Article Views (full-text article views including HTML views, PDF and ePub downloads, according to the available data) and Abstracts Views on Vision4Press platform.
Data correspond to usage on the plateform after 2015. The current usage metrics is available 48-96 hours after online publication and is updated daily on week days.
Initial download of the metrics may take a while.


