Fig. 13
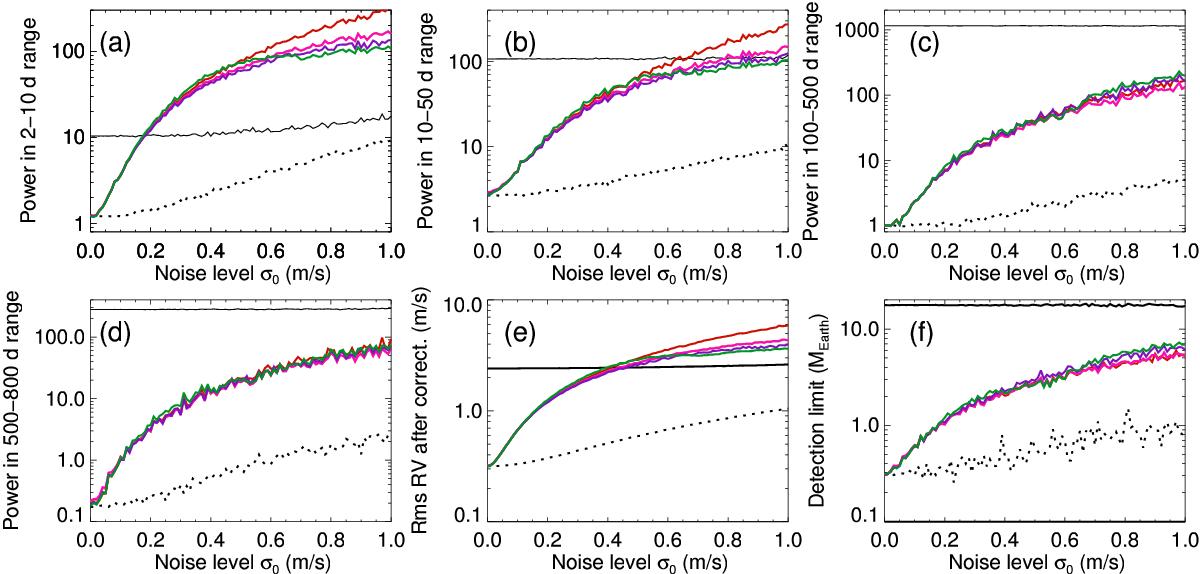
Panel a: maximum power in the 2−10 d range computed on the periodogram of the RV residuals after correction versus σ0 for S1, full temporal sampling (with a 4 month gap every year) and different methods (see Fig. 10, lower panels, for the color-coding; the curves for methods 3 and 4 are almost indistinguishable here). The solid black line shows the power before correction and the dotted black line the power after correction in an ideal case (i.e., correction with the reference ![]() ). Panel b: same, but for the power in the range 10−50 d. Panel c: same, but for the power in the range 100−500 d. Panel d: same, but for the power in the range 500−800 d. Panel e: same, but for the rms of the residuals after correction. Panel f: same, but for the detection limits at 480 d.
). Panel b: same, but for the power in the range 10−50 d. Panel c: same, but for the power in the range 100−500 d. Panel d: same, but for the power in the range 500−800 d. Panel e: same, but for the rms of the residuals after correction. Panel f: same, but for the detection limits at 480 d.
Current usage metrics show cumulative count of Article Views (full-text article views including HTML views, PDF and ePub downloads, according to the available data) and Abstracts Views on Vision4Press platform.
Data correspond to usage on the plateform after 2015. The current usage metrics is available 48-96 hours after online publication and is updated daily on week days.
Initial download of the metrics may take a while.