Fig. 14
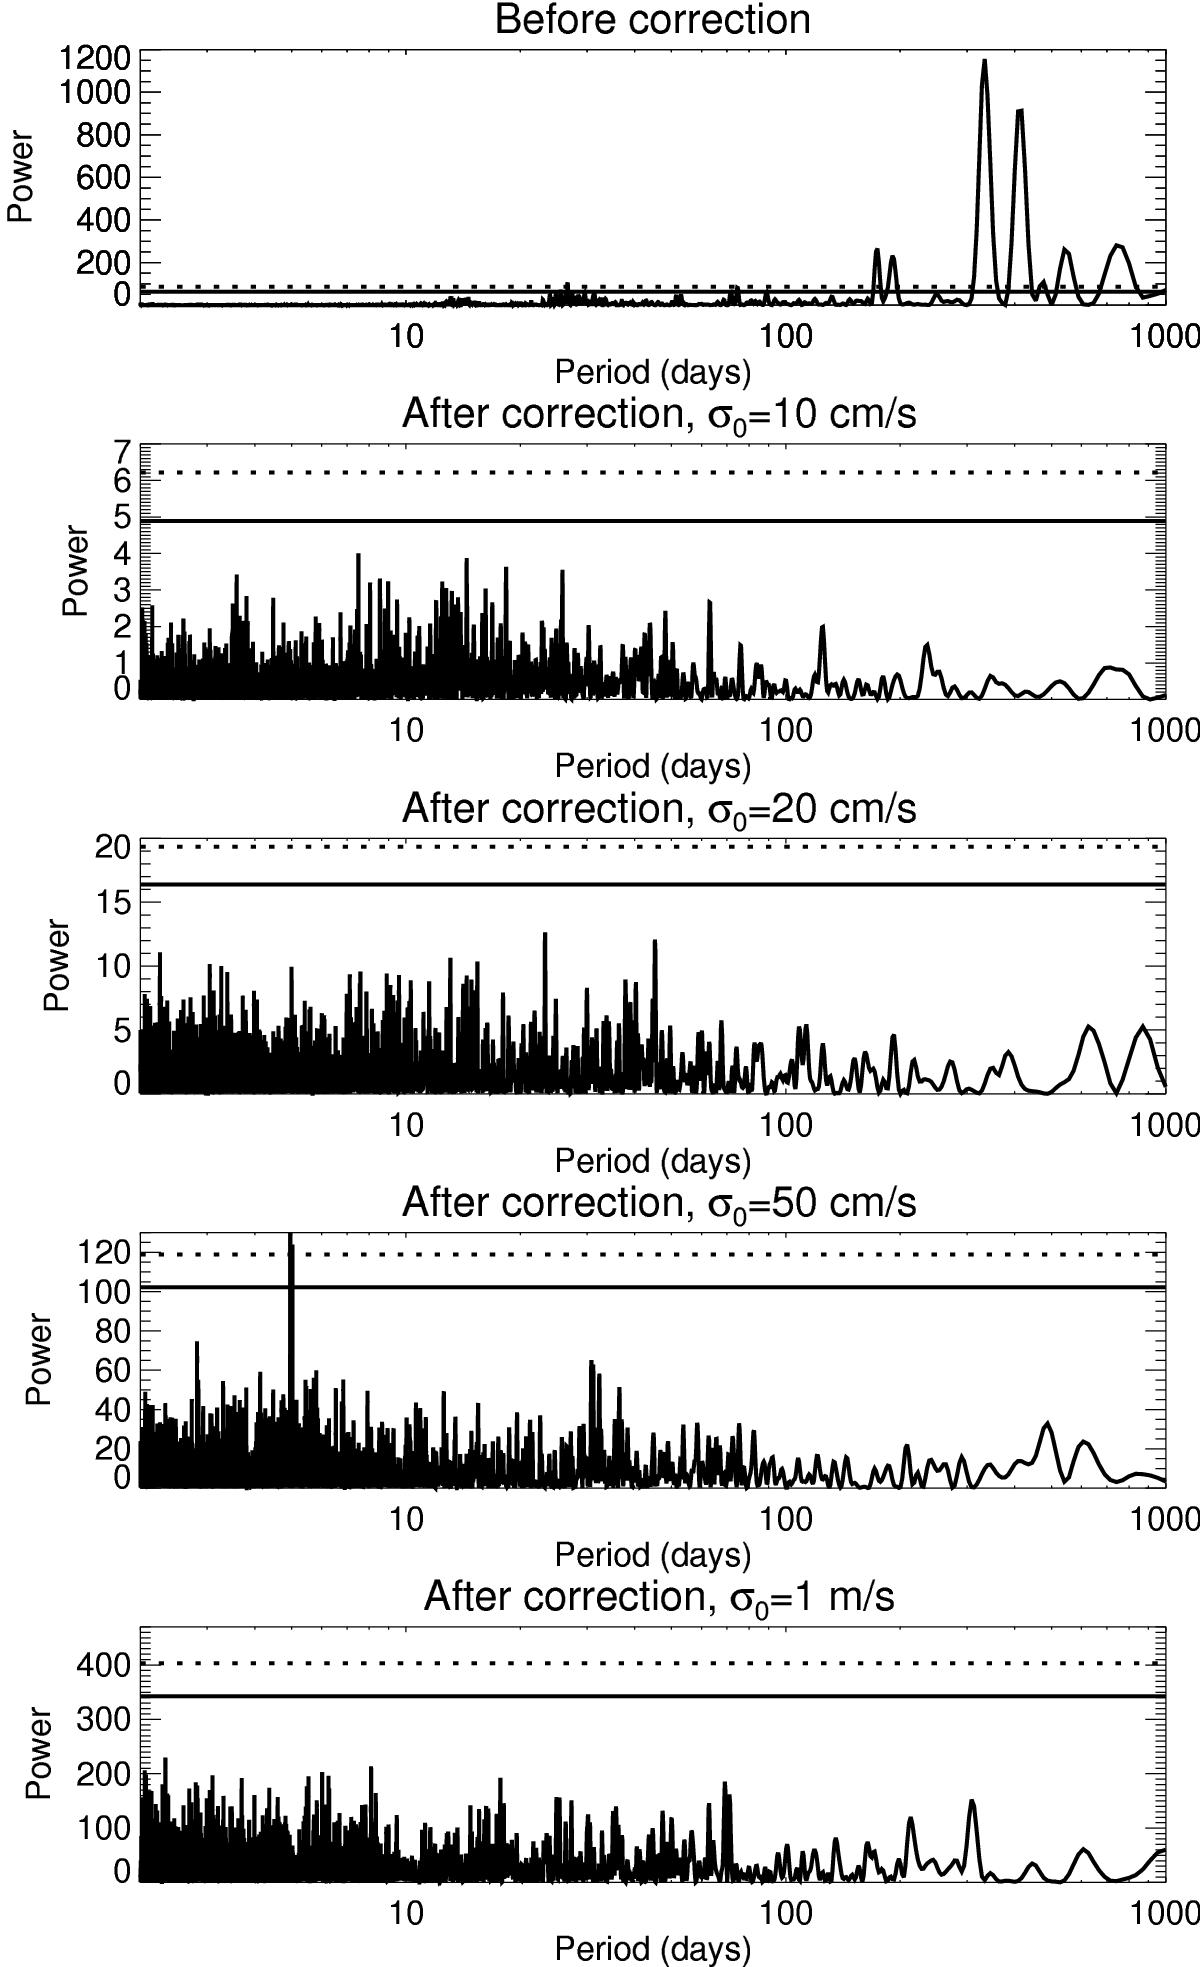
First panel: periodogram of the simulated time series before correction (all points except for a 4 month gap), for a σ0 of 10 cm/s. From second to fifth panel: same after correction using method 1 and the set of lines S1, respectively for a σ0 of 10 cm/s, 20 cm/s, 50 cm/s, and 1 m/s. The horizontal lines show the false alarm probability (fap) at 1% (dashed lines) and 10% (solid lines).
Current usage metrics show cumulative count of Article Views (full-text article views including HTML views, PDF and ePub downloads, according to the available data) and Abstracts Views on Vision4Press platform.
Data correspond to usage on the plateform after 2015. The current usage metrics is available 48-96 hours after online publication and is updated daily on week days.
Initial download of the metrics may take a while.