Fig. 15
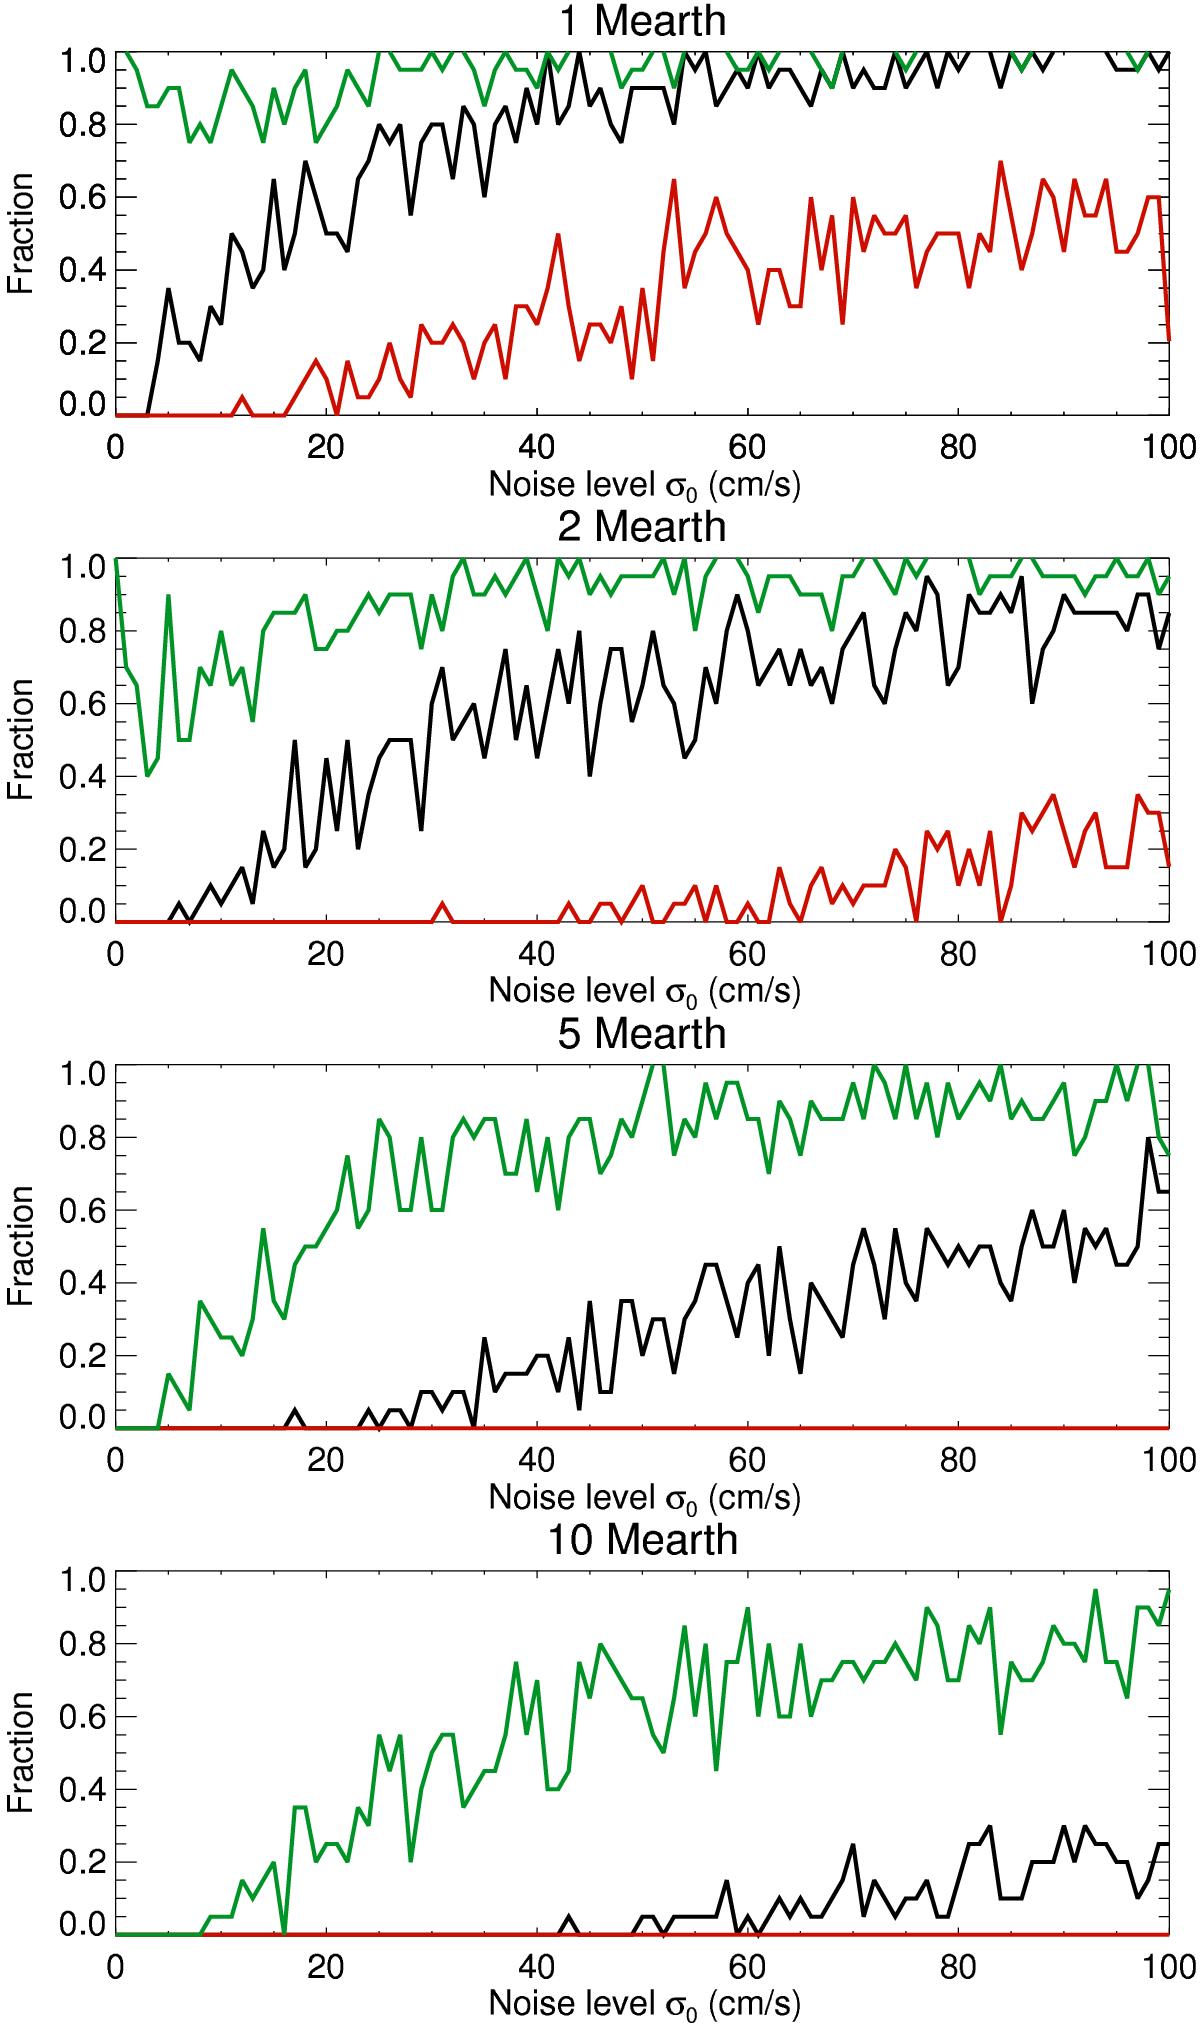
First panel: fraction of realizations for which the planet amplitude after correction differs by more than 50% (black) and 10% (green) from the theoretical value. The red curve shows the 50% curve for the signal ![]() +planet+noise, i.e., what would be obtained with a perfect correction. Second panel: same, but for 2 MEarth. Third panel: same, but for 5 MEarth (dotted line at the zero level). Fourth panel: same, but for 10 MEarth (dotted line at the zero level).
+planet+noise, i.e., what would be obtained with a perfect correction. Second panel: same, but for 2 MEarth. Third panel: same, but for 5 MEarth (dotted line at the zero level). Fourth panel: same, but for 10 MEarth (dotted line at the zero level).
Current usage metrics show cumulative count of Article Views (full-text article views including HTML views, PDF and ePub downloads, according to the available data) and Abstracts Views on Vision4Press platform.
Data correspond to usage on the plateform after 2015. The current usage metrics is available 48-96 hours after online publication and is updated daily on week days.
Initial download of the metrics may take a while.