Free Access
Fig. 16
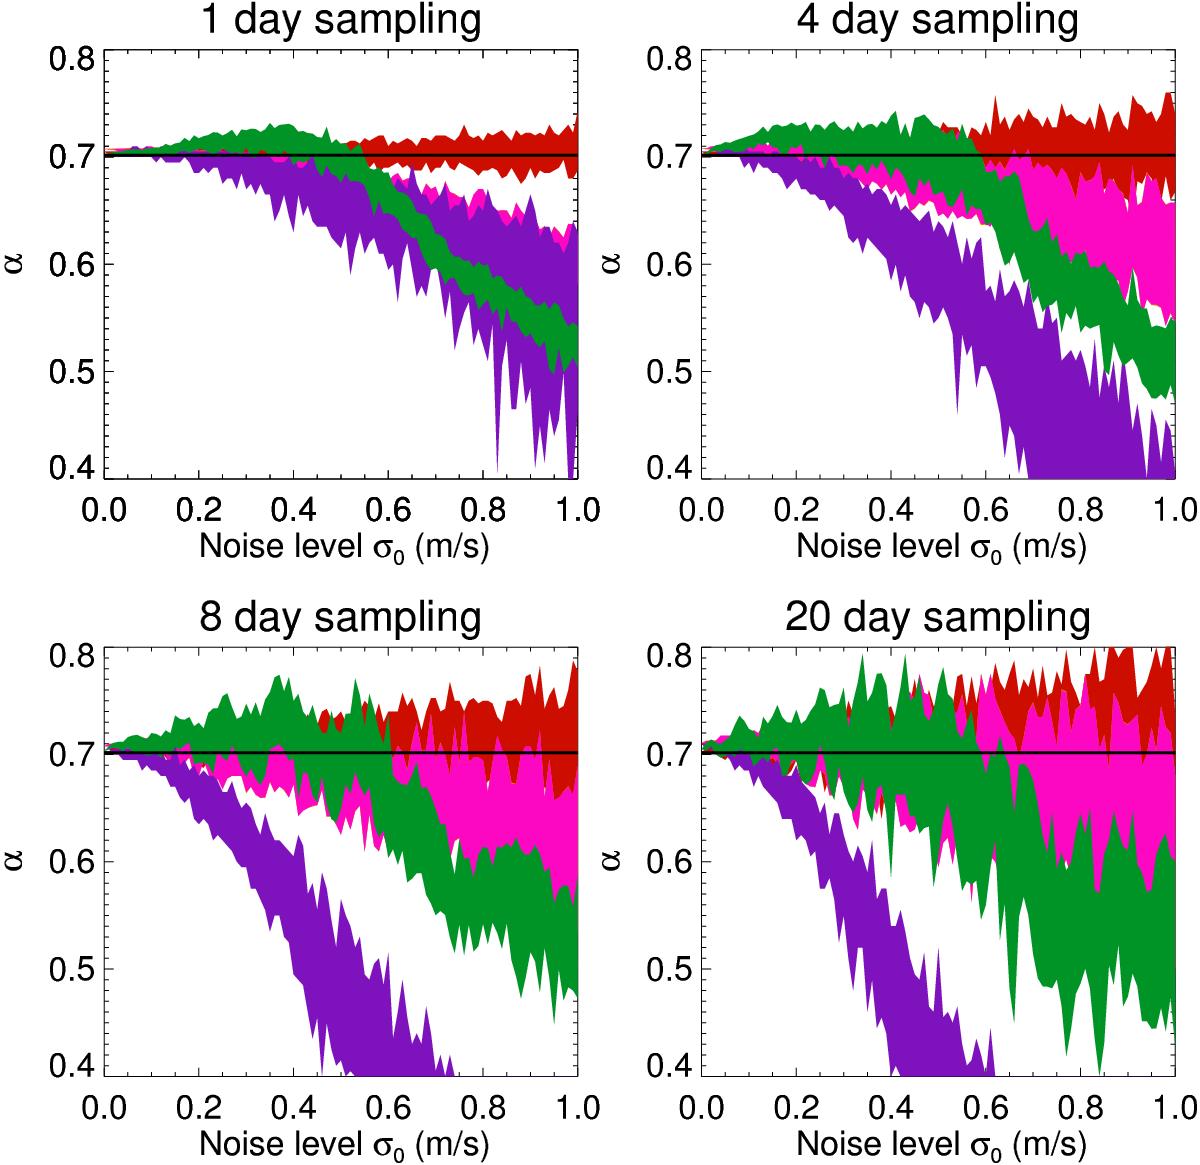
Upper left panel: reconstructed α versus the noise level for the set of lines S1 and all realizations for a sampling of 1 day (see Fig. 10 for color-coding). Upper right panel: same, but for 4 days. Lower left panel: same, but for 8 days. Lower right panel: same, but for 20 days.
Current usage metrics show cumulative count of Article Views (full-text article views including HTML views, PDF and ePub downloads, according to the available data) and Abstracts Views on Vision4Press platform.
Data correspond to usage on the plateform after 2015. The current usage metrics is available 48-96 hours after online publication and is updated daily on week days.
Initial download of the metrics may take a while.