Fig. 17
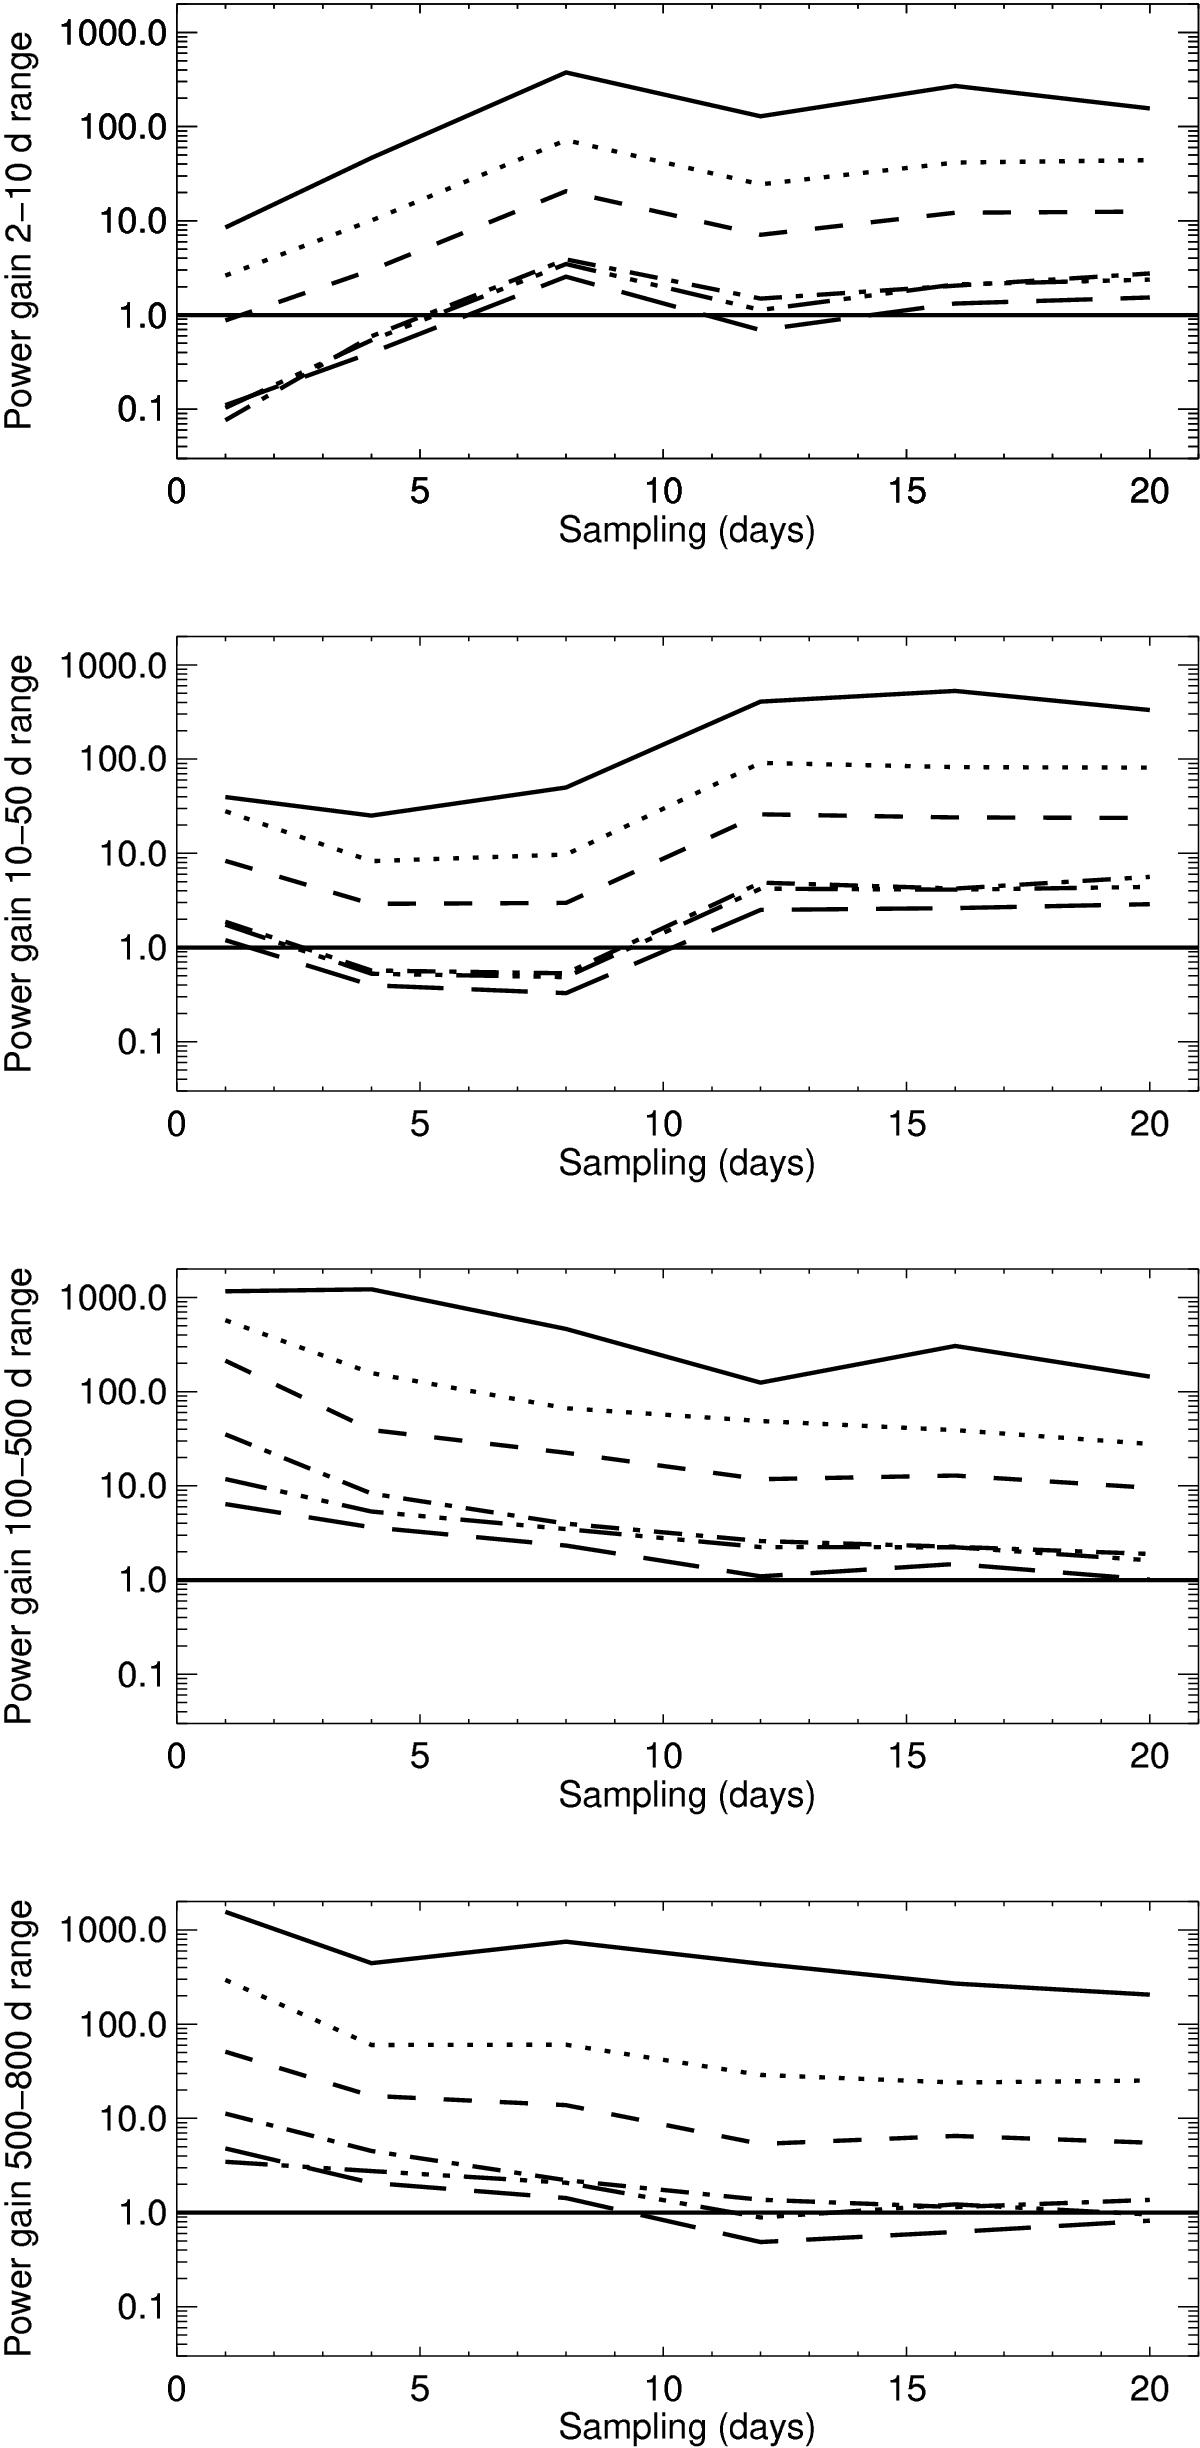
First panel: ratio between the maximum power (in the range 2−10 d) in the periodograms before correction and after correction (method 1) for various noise levels, showing the gain in power: no noise (solid line), 10 cm/s (dotted line), 20 cm/s (dashed line), 50 cm/s (dot-dashed line), 75 cm/s (dot-dot-dot-dashed line), 1 m/s (long-dashed line). The horizontal solid line represent a gain of A (i.e., no improvement). Second panel: same, but for the period range 10−40 d. Third panel: same, but for the period range 100−500 d. Fourth panel: same, but for the period range 500−800 d.
Current usage metrics show cumulative count of Article Views (full-text article views including HTML views, PDF and ePub downloads, according to the available data) and Abstracts Views on Vision4Press platform.
Data correspond to usage on the plateform after 2015. The current usage metrics is available 48-96 hours after online publication and is updated daily on week days.
Initial download of the metrics may take a while.