Fig. 18
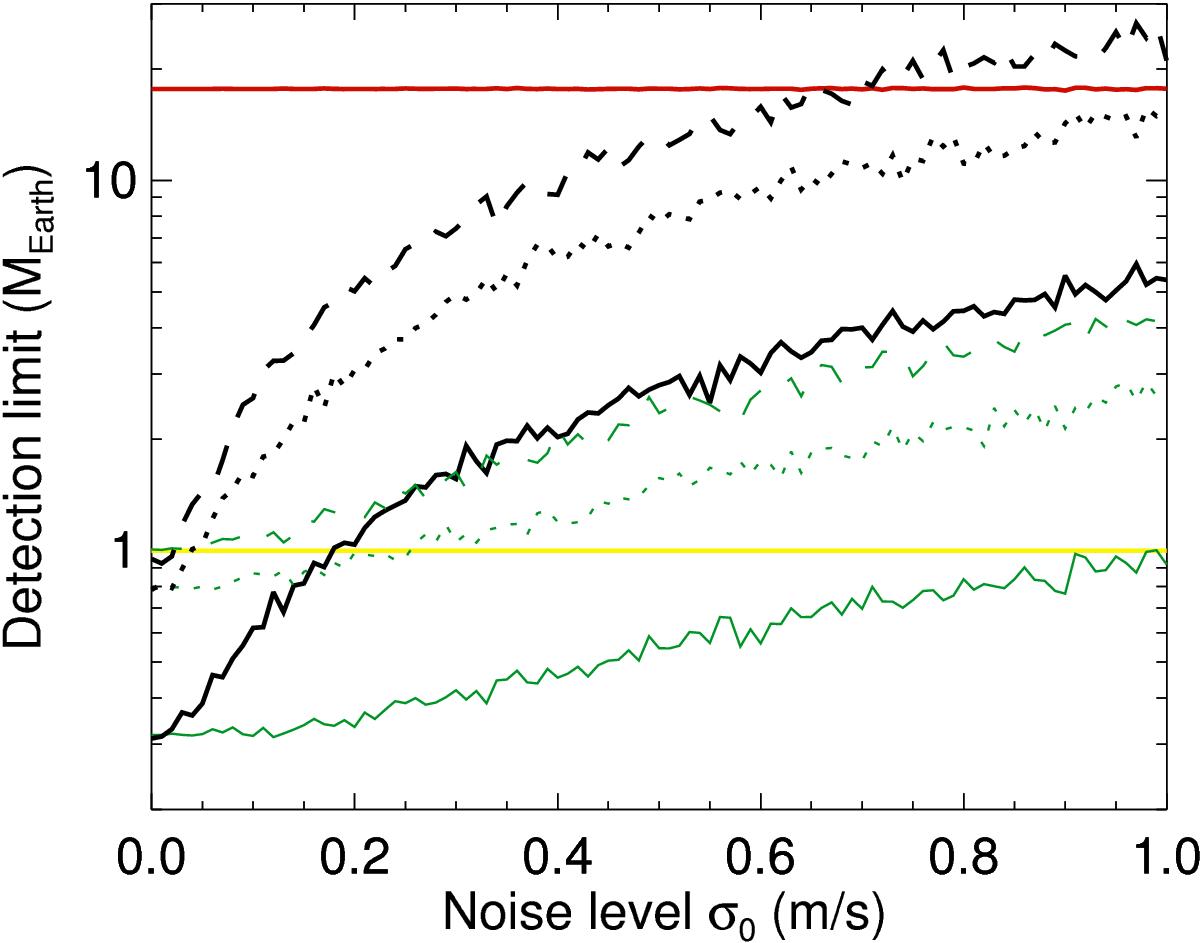
Detection limits versus the noise levels after correction for various sampling (black lines): 1 day (solid line), 8 days (dotted line), and 20 days (dashed line), averaged over the 20 realizations of the noise. The green curves show the detection limit for ![]() for the same sampling (same line code). The upper horizontal red line corresponds to the detection limit before correction for the 1 day sampling, and the horizontal yellow line the 1 MEarth detection limit level.
for the same sampling (same line code). The upper horizontal red line corresponds to the detection limit before correction for the 1 day sampling, and the horizontal yellow line the 1 MEarth detection limit level.
Current usage metrics show cumulative count of Article Views (full-text article views including HTML views, PDF and ePub downloads, according to the available data) and Abstracts Views on Vision4Press platform.
Data correspond to usage on the plateform after 2015. The current usage metrics is available 48-96 hours after online publication and is updated daily on week days.
Initial download of the metrics may take a while.