Fig. 19
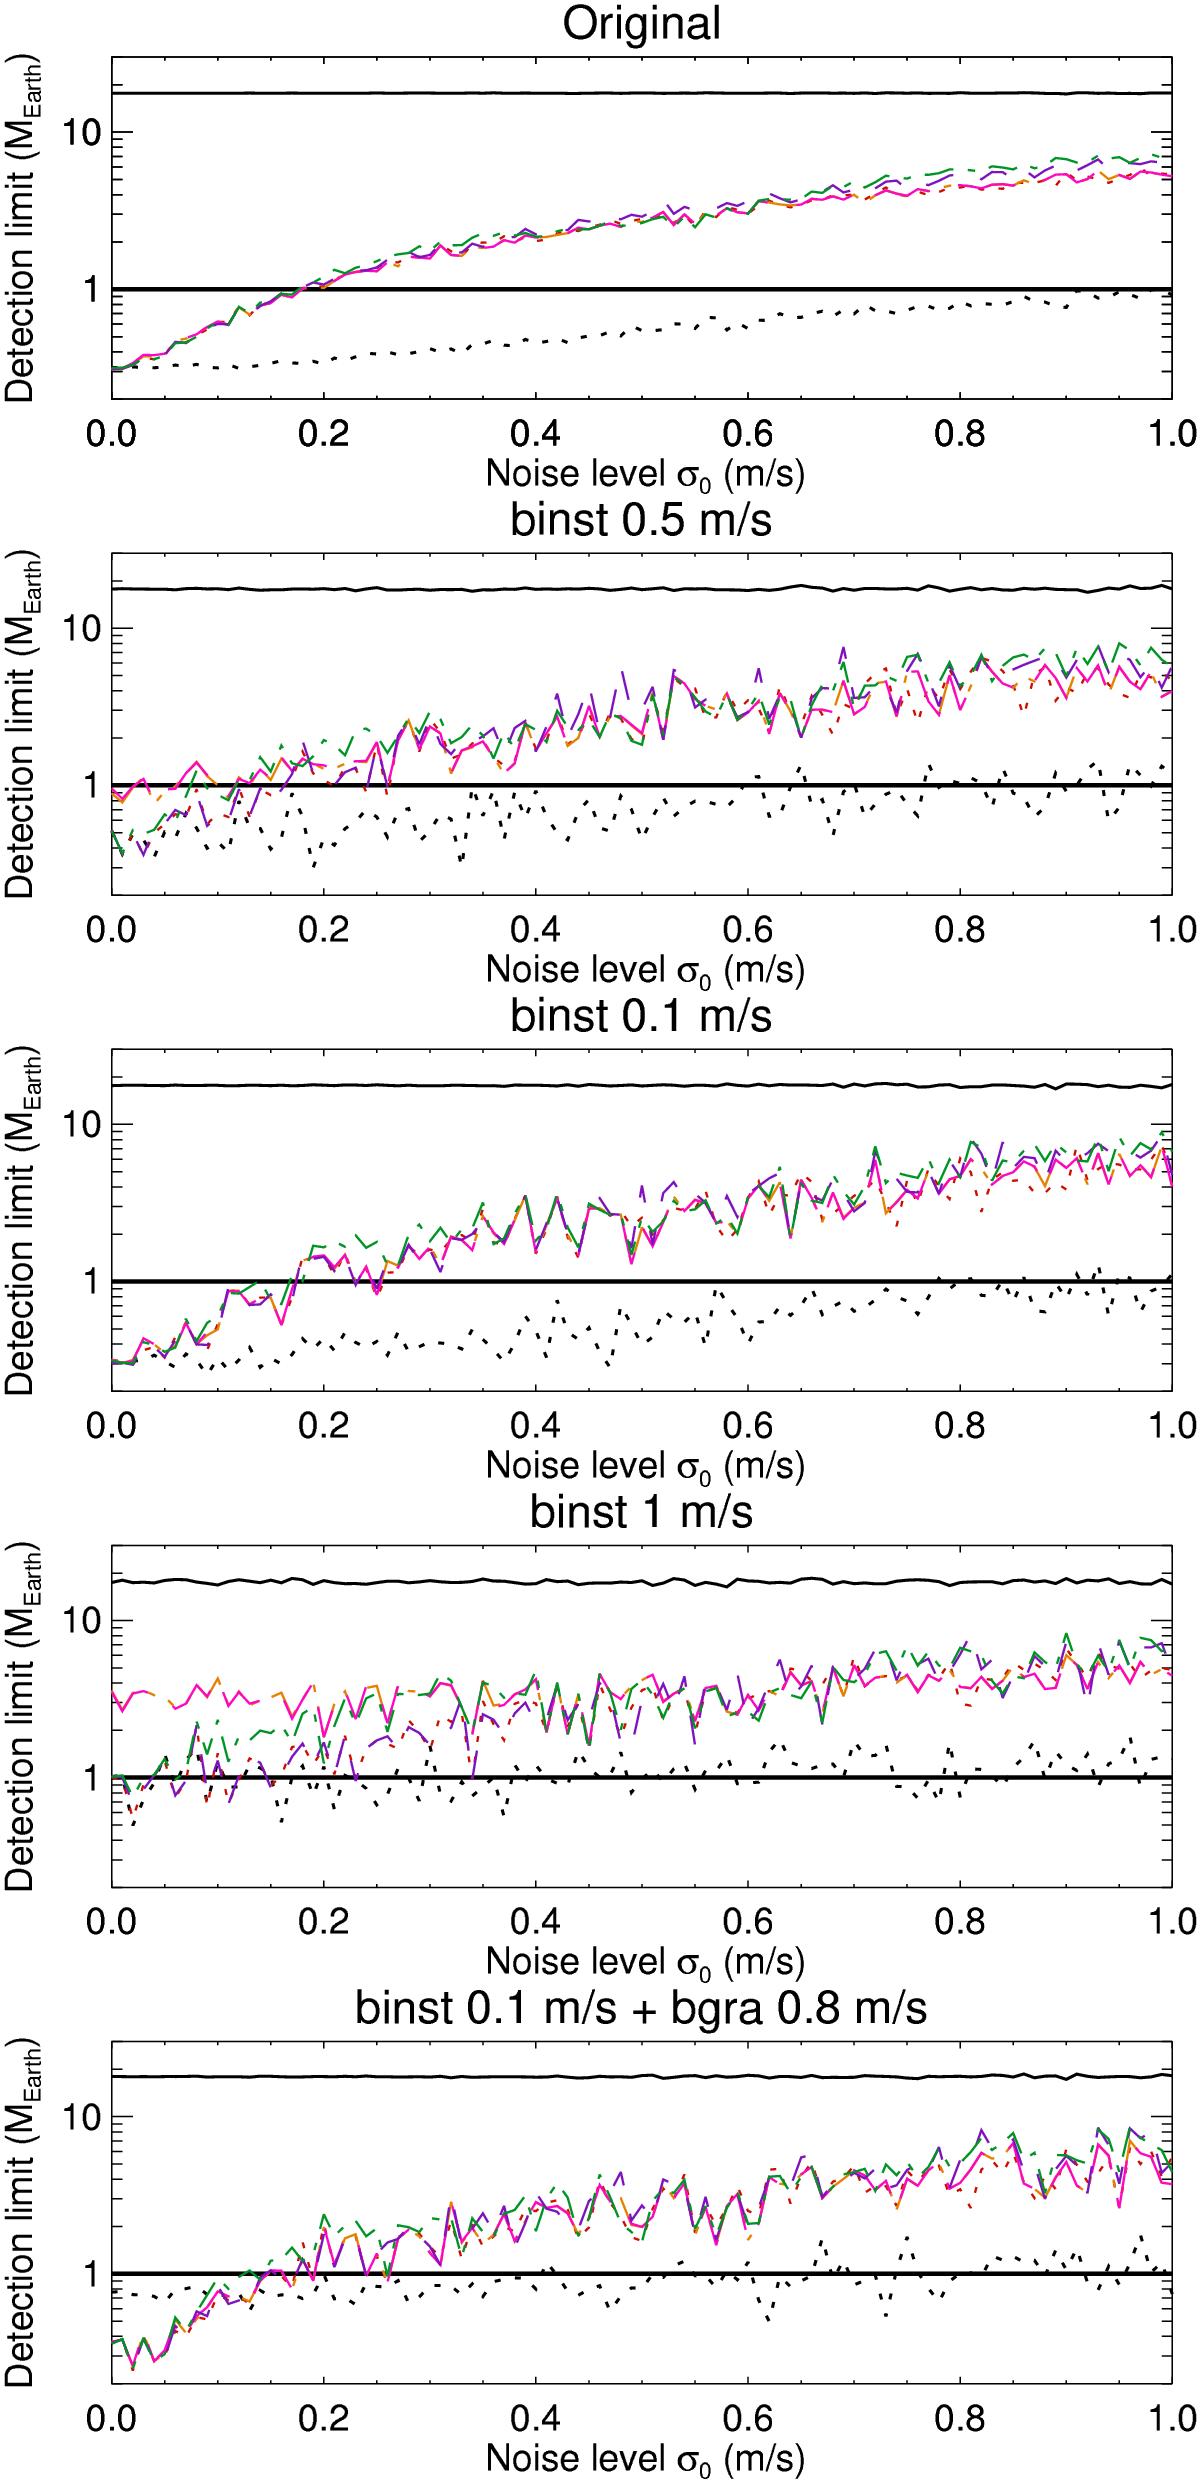
First panel: detection limits versus noise for the full sample and no additional noise, averaged over all realizations. Color- and line-coding as in Fig. 13, panel f. The horizontal line is the 1 MEarth detection limit level. Second panel: same, but for binst(t) of 0.5 m/s, for one realization. Third panel: same, but for binst(t) of 0.1 m/s, for one realization. Fourth panel: same, but for binst(t) of 1 m/s, for one realization. Fifth panel: same, but for binst(t) of 0.1 m/s added to bgra(t) of 0.8 m/s, for one realization.
Current usage metrics show cumulative count of Article Views (full-text article views including HTML views, PDF and ePub downloads, according to the available data) and Abstracts Views on Vision4Press platform.
Data correspond to usage on the plateform after 2015. The current usage metrics is available 48-96 hours after online publication and is updated daily on week days.
Initial download of the metrics may take a while.