Fig. 7
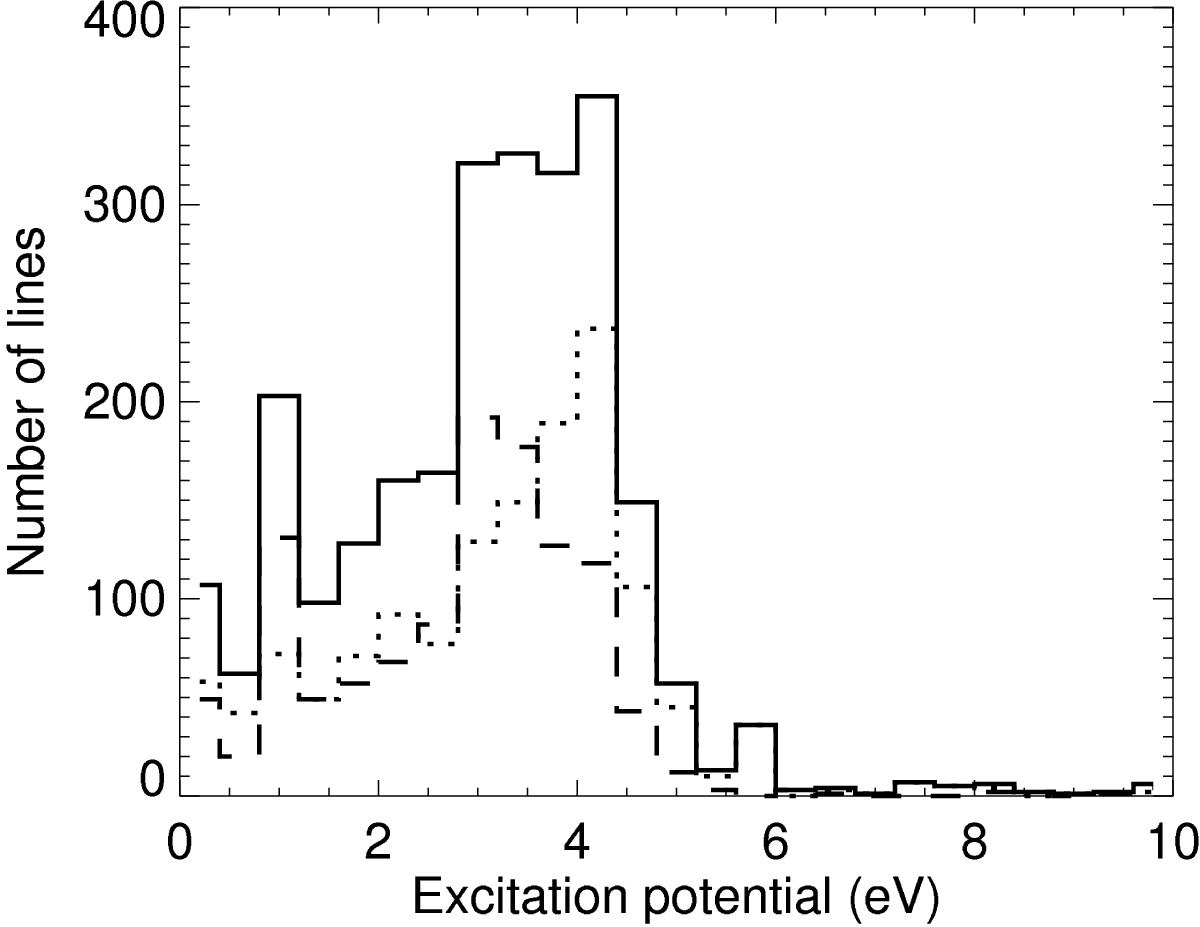
Distribution of the excitation potentials for 2532 lines of S0 (solid line), 1146 lines of S1 (dashed line), and 1386 lines of S2 (dotted line). Line identifications were made using the spectrum of Wallace et al. (2007) and the solar spectrum available in the BASS2000 archive2, and the excitation potentials were retrieved from the VALD archive (Piskunov et al. 1995; Ryabchikova et al. 1999, 2015; Kupka et al. 1999, 2000).
Current usage metrics show cumulative count of Article Views (full-text article views including HTML views, PDF and ePub downloads, according to the available data) and Abstracts Views on Vision4Press platform.
Data correspond to usage on the plateform after 2015. The current usage metrics is available 48-96 hours after online publication and is updated daily on week days.
Initial download of the metrics may take a while.