Fig. 8
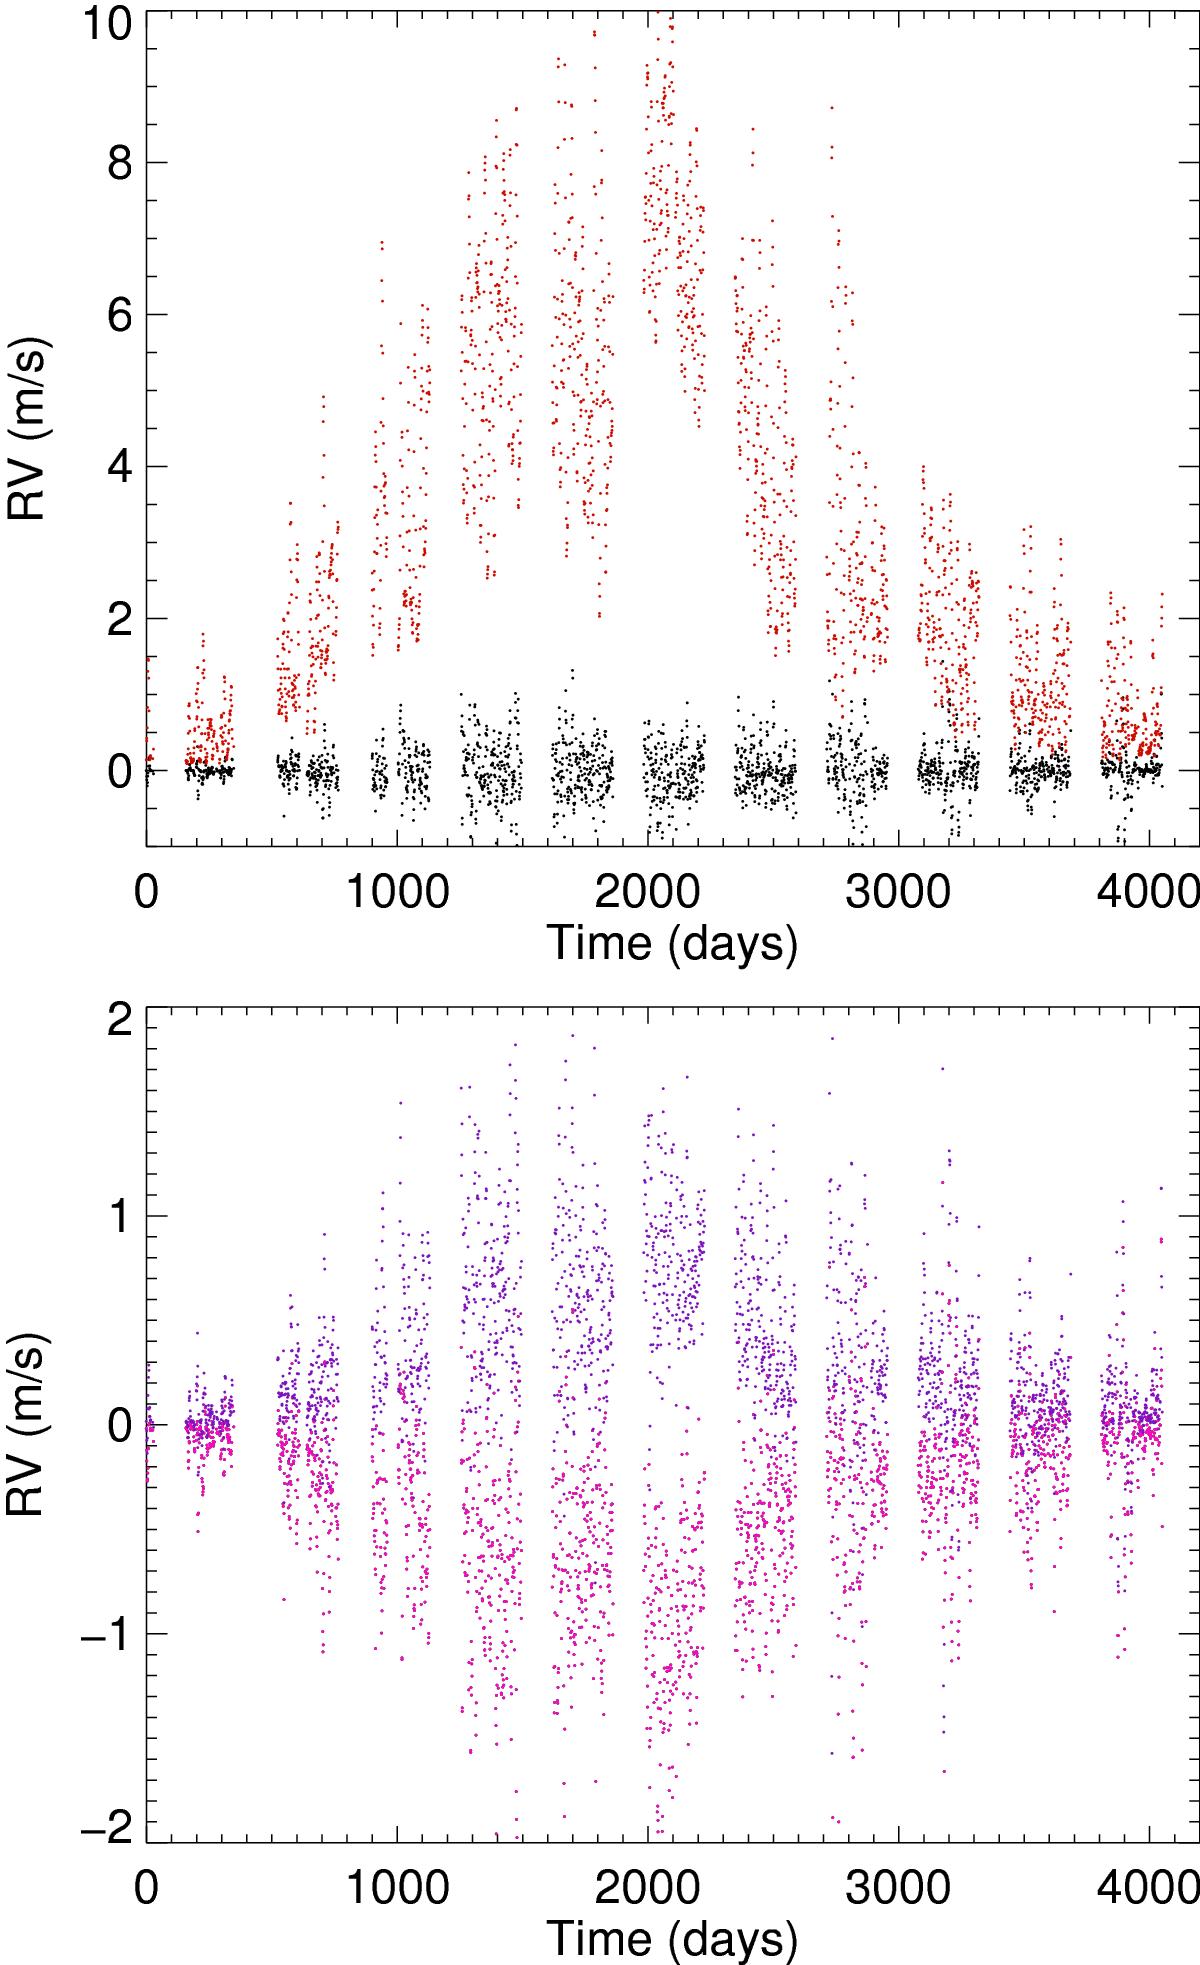
Upper panel: reconstructed RV due to spots and plages ![]() (black) and convection attenuation in plages
(black) and convection attenuation in plages ![]() (red), with no noise, for the set of lines S1, full temporal sampling (with a 4 month gap every year), and method 1. Lower panel: reconstructed
(red), with no noise, for the set of lines S1, full temporal sampling (with a 4 month gap every year), and method 1. Lower panel: reconstructed ![]() for a value of α that is 5% too high (purple) and 5% too low (pink) for the set of lines S1, full temporal sampling (with a 4 month gap every year).
for a value of α that is 5% too high (purple) and 5% too low (pink) for the set of lines S1, full temporal sampling (with a 4 month gap every year).
Current usage metrics show cumulative count of Article Views (full-text article views including HTML views, PDF and ePub downloads, according to the available data) and Abstracts Views on Vision4Press platform.
Data correspond to usage on the plateform after 2015. The current usage metrics is available 48-96 hours after online publication and is updated daily on week days.
Initial download of the metrics may take a while.